Quantcast
Channel: David Burch Navigation Blog

Practical Use of ASCAT Winds in Weather Routing

$
0
0

ASCAT winds are satellite scatterometer measurements of wind speed and direction on the surface of the ocean and other large bodies of water, normalized to a 10 m height. The data resolution is 25 km, which is comparable to the resolution of typical global weather models available to the public such as GFS (27.8 km) and ECMWF (44 km). New data are available typically four times a day, from various combinations of two satellites, Metop-B and Metop-C, tracking N-NE (ascending) or S-SW (descending), bringing us data from either the port or starboard side of their split data swaths. For background in ASCAT, see www.starpath.com/ascat.  There is a video at the end here demonstrating the use of the data.

Before presenting the specifics of how to use this data, let me back up a moment and put this in perspective. Wind speed and direction are the key factors in marine navigation, in large part because the wind makes the waves, which can be a hazard to any size vessel. For sailors, it is even more primary because wind is their engine. Thus this is the most fundamental information available. It is like having the ocean covered with thousands of buoys measuring wind speed and direction.  But unlike isolated real ocean buoys who give us data every 10 min in some cases, hourly at worst, the ASCAT data covers large swaths of the ocean but only give us data 3 or 4 times a day. 

In a sense, the ASCAT data have done a major job for us even if we do not look at it, because it is a crucial input to the global weather models whose forecasts we must rely on for routing. But even though the models have assimilated the latest ASCAT data, the model forecasts are not guaranteed to be correct. It is specifically not a goal of the models to reproduce the ASCAT and buoy observations. They have a broader goal to produce the best overall forecast at many levels of the atmosphere. In short, the model forecasts may in fact not be correct in some circumstances, which is why we must compare several models to decide which is likely the best.

And indeed, circling back to check a model forecast with actual ASCAT measurements at a specific place and time we care about is one of the primary reasons for us to access the ASCAT data ourselves. If one model forecast agrees with the ASCAT measurements and another does not, it is most likely the better one to use for our routing computations

Another reason to continually monitor the ASCAT wind measurements for our intended route is the occasional observation of localized anomalous flow. We might spot a notable hole in the wind or a shear line that is not apparent in the global model forecast. In these cases, we have to realize that the ASCAT are real data. That is what the wind was doing at that time, regardless of what the model might imply or not show, and we need to route with that in mind. 

The other aspect of "perspective" is to recognize that even though these ASCAT wind measurements are indeed the most fundamental data we care about, the use of this data, which takes several easy, but non-standard procedures,  is definitely in the realm of "going the extra mile" to learn the very most we can  about the wind ahead of us. For a racing sailor, this is standard operating procedure, but when cruising it would be called on less often, unless we are negotiating a dangerous wind pattern or, more likely, some light air pattern in which we are just  looking for enough wind to get there. 

We have presented this perspective in the past, and in earlier editions of our text Modern Marine Weather, but then after outlining the basic guides to getting the data by standard procedures, we moved on. Based on discussions with practicing navigators, however, it seems that we needed a more specific procedure for accessing this crucial data, and that is what we have created.

We have semi-empirically compiled graphic indexes of the available data and pass times for the typical cruising and racing waters around North America and Europe, presented below, as well as ways to automatically access the latest available data of interest. (Note that we are not covering here the even more convenient means of obtaining this data in grib format, which can be achieved with LuckGrib or Expedition. Users of those two fine apps, might still find some benefit from the timing structure we present here.)


We assigned the names to these regions; they are not official.


Each of these named regions provide a potential of 4 data opportunities in each 24 hr period, and the only way to see which might be latest data available is to download all 4 images. The file size varies from 20 to 40 kb, depending on how much data it includes. The UTC times shown (±1 hr) tell us satellite passage times of the 4 opportunities for new data. They occur in pairs, 13 hours apart, where the two passes of each pair are about an hour apart.

For example, in Biscay, we have data passes at 10:30 and 21:30, ± 1 hr. If I go to the ASCAT web site now and look at what passes took place yesterday, I get the files shown below. 


In the top we see the two passes at 21:30 ± 1h and on the bottom the two at 10:30 ± 1hr.  These are the actual live transit times of the satellites, representing the valid times of the wind measurements. On other days, these times will be different, but remain within these windows. 

But we do not get this data instantly. It takes 2 to 3 hr to process the data, so for the Biscay region, we would only look for new data at about 00:30 and 1430. Note that this delay time or latency is about the same as it is with the model forecasts, which also take 2 to 3 hr to process for our consumption in grib format. 

To clarify the concept that there will be new data about 4 times every 24hr: consider the example of San Francisco with valid times of 0525 and 1825 UTC, ± 1 hr, noting that it takes about 2 hr to process the data.

Thus while underway or planning a route across these waters, we would go to Google Earth (or wherever we are looking at the data) at about 0725 or later UTC and download all four passes given. We do not know ahead of time which of the four will bring the new data but most likely two or them will have a swath of new data that will be valid at 0525 ± 1hr. Then again at 2025 or later we would again download all four of the passes and among those will likely be two new data swaths valid at 1825 ± 1hr.

That is in effect a cookbook approach to the data, using our indexes as guides for when to look. We will not get new data between these two periods. We then have to correlate the valid times with the model times and forecasts at hand.

There are several ways to get the data underway. You can request the images from Saildocs or you can use the custom KML files we made to use in either qtVlm or the desktop version of Google Earth, which is a free download for Mac or PC. The KLM files can also be adapted for use in OpenCPN. For the last two methods at sea, we need to link our internet connection to a satphone or Iridium Go type device.  With those procedures the links can be stored in the apps and accessed with a button click.

To request the files from Saildocs, use this request structure for Biscay (green number from our index), meaning send this text in the body to query@saildocs.com (colors added to show what changes for each file, but using this method, you just need to change the 133 for Biscay to say 86 for Bermuda.

Send https://manati.star.nesdis.noaa.gov/ascat_images/cur_25km_METB/zooms/WMBas133.png
Send https://manati.star.nesdis.noaa.gov/ascat_images/cur_25km_METB/zooms/WMBds133.png
Send https://manati.star.nesdis.noaa.gov/ascat_images/cur_25km_METC/zooms/WMBas133.png
Send https://manati.star.nesdis.noaa.gov/ascat_images/cur_25km_METC/zooms/WMBds133.png

This will get you the 4 images of the data that you can then analyze manually from the graphics alone. They have a Lat-Lon grid as shown above but will not be georeferenced into a nav program. But the  main point is you can get the data that easily and our indexes show what to ask for and when.

Our ASCAT page links to articles and demos with details, plus has a link to get all of the KML files and the graphic indexes. We will add more examples as soon as possible, and in particular the process of comparing with model forecasts.


Viewing ASCAT winds in Google Earth desktop version (using the Starpath indexes above.)


Viewing ASCAT Wind Measurements in OpenCPN

$
0
0

This article outlines the value of ASCAT wind data, and shows how work we have done at Starpath to make these files available on Google Earth can be transcribed to the format needed to be viewed in OpenCPN.  This is effectively a request to OpenCPN developers to automate this conversion process and make the full set of ASCAT data files and then incorporate them into the standard weatherfax plugin.

_______

ASCAT is the name of the scatterometer on two EUMETSAT satellites, Metop-B and Metop-C. They circle the earth in sun-synchronous polar orbits every 1h 41m (101.3m) measuring ocean surface wind speed and direction. They are in the same orbit, but on opposite sides, so they are about 50 min apart, during which the earth rotates 50 min x (15º lon/60 min), or 12.5º of Lon.  Thus the data from C is about 50 min later and  covers a swath of the earth that is 12.5º of Lon farther west—or vice versa, thinking of B following C. We  have extended background on ASCAT at starpath.com/ascat.

These direct wind measurements are the key information needed for weather routing, with a primary use being to evaluate the numerical weather model forecasts. The data are like having thousands of buoys at sea measuring the wind speed and direction, and if a model is to be dependable it should closely match what we see in the buoy measurements.  Also we will periodically see real holes in the wind, or wind shear lines in the ASCAT measurements that are not forecasted in any model. The resolution of the ASCAT data (25 km) is about the same as that of the GFS model (27 km). The expected accuracy of the satellite measurements and that of the model forecasts is about the same, so very roughly ± 2 kts in wind speed and ± 20º in wind direction has to be considered in agreement. 

Remember that the final goal of any numerical weather model is not to reproduce all of the specific observations that went into the computation, but rather to create the best overall forecast at all levels of the atmosphere, which almost always involves some compromise in matching the surface data. Thus, even though the ASCAT measurements are key data assimilated into any global model computation, we should not be surprised that we can learn real and significant discrepancies in the model forecast by looking at the same ASCAT data it was looking at, and when these do disagree, it is the measurements that are of course the correct answer.

ASCAT wind data are available in grib format, but only from two commercial sources, LuckGrib and Expedition, and their data cannot be viewed in other nav programs. This important data, however, are also readily available in graphic format, and OpenCPN is well suite to displaying this data using the powerful WeatherFax plugin—and the process of setting that up is the topic at hand.

We have an important background article on this process Updating Internet File Source for OpenCPN WeatherFax Plugin, which pretty much describes the process in general, but here we need to be more specific on how we generalize the ASCAT data.

We have created two graphic indexes of the files available, one for adjacent US waters the other for adjacent European waters. 


Each of these regions that we have named have four ASCAT files, ascending (satellite moving north, data swaths tilt to the east and descending (satellite moving south, data swaths tilt to the west), one for Metop-B and one for Metop-C.

Here are the 4 examples for what we call the San Francisco region.

San Francisco ASCAT B - Ascending.kml 

San Francisco ASCAT B - Descending.kml

San Francisco ASCAT C - Ascending.kml 

San Francisco ASCAT C - Descending.kml 

You can download anyone or all and drag onto Google Earth (desktop version) to see the latest ASCAT data in that region, defined above. Samples are below (click it, then right-click, open in new tab, and zoom for detailed view).


The times shown in our indexes tell us when new data are expected, which will come in pairs about 50 min apart, with the pairs separated aby about 13 hr.  The times are the valid times of satellite passage, ± 1 hr, but we must wait about 2 hr for the data to be analyzed and made available.  Thus in Biscay, we would expect see new data at about 1230 and 2320 UTC, adding say 30 min to save on air time by asking too early.  Once you have this set up in OpenCPN or Google Earth you will quickly learn how it works. Video examples are listed at starpath.com/ascat.

With that background, we now get to the process of how to convert what we have provided to work with OpenCPN using the weatherfax plugin, which has one of the most convenient displays of graphic weather data of any navigation program.

We have videos on how images are displayed in the weathefax plugin, and as the link above explains OpenCPN stores the data needed for quick display of any image in two files. One provides the link info stating where the data is online and the other specifies the georeferencing coordinate data so the images are displayed in the right place.

The data links are provided in a series of about a dozen XML files called, for example, 

WeatherFaxInternetRetrieval_NAVY.xml, which looks like

<?xml version="1.0" encoding="utf-8" ?>

<OCPNWeatherFaxInternetRetrieval>

  <Server Name="NAVY"Url="https://www.ncei.noaa.gov/jag/navy/data/satellite_analysis/">

      <Region Name="Gulf Stream">

        <!-- Gulf Stream charts -->

        <Map Url="gsncofa.gif"Contents="North Altantic"Area="GS1" />

        <Map Url="gsscofa.gif"Contents="Golf of Mexico"Area="GS2" />

        <Map Url="gsneofa.gif"Contents="Coast Guard North Atlantic"Area="GS3" />

        <Area Name="GS1"lat1="30N"lat2="53N"lon1="80W"lon2="45W" />

        <Area Name="GS2"lat1="17N"lat2="40N"lon1="98W"lon2="65W" />

        <Area Name="GS3"lat1="30N"lat2="60N"lon1="80W"lon2="35W" />

      </Region>

  </Server>

 </OCPNWeatherFaxInternetRetrieval>


These files are located on a PC in:

C:\Users\username\AppData\Local\opencpn\plugins\weatherfax_pi\data


on a Mac, they are located in:

HD\Users\username\Library\Application Support\OpenCPN\Contents\SharedSupport\plugins\weatherfax_pi\data\


We also need to work on the coordinates file which has to include an element for each "server name."

This file is called CoordinateSets.xml  Below we see the section that covers the NAVY server.


   <Coordinate Name="NAVY - Gulf Stream - GS3"X1="304"Y1="60"Lat1="59.00000"Lon1="-76.00000"X2="2122"Y2="1285"Lat2="32.00000"Lon2="-40.00000"Mapping="FixedFlat"InputPoleY="-1515"InputEquator="3031.00000"InputTrueRatio="1.0000"MappingMultiplier="1.0000"MappingRatio="1.0000" />

    <Coordinate Name="NAVY - Gulf Stream - GS1"X1="101"Y1="28"Lat1="53.00000"Lon1="-80.00000"X2="2375"Y2="927"Lat2="32.00000"Lon2="-45.00000"Mapping="FixedFlat"InputPoleY="-2365"InputEquator="3475.00000"InputTrueRatio="1.0000"MappingMultiplier="1.0000"MappingRatio="1.0000" />

    <Coordinate Name="NAVY - Gulf Stream - GS2"X1="376"Y1="82"Lat1="38.00000"Lon1="-94.00000"X2="2236"Y2="746"Lat2="20.00000"Lon2="-67.00000"Mapping="FixedFlat"InputPoleY="-3444"InputEquator="2755.00000"InputTrueRatio="1.0000"MappingMultiplier="1.0000"MappingRatio="1.0000" />


So what we need for OpenCPN is a new set of Retrieval servers and we need new Coordinate Name entries for each of the custom regions we have defined, and these are likely best duplicated, one for Metop-B and one for Metop-C, which makes access to the data a bit easier. 

The new WeatherFaxInternetRetrieval servers would look something like this which covers just two regions. The other 46 would have to be entered into 


<?xml version="1.0" encoding="utf-8" ?>

<OCPNWeatherFaxInternetRetrieval>

<Server Name="ASCAT B"Url="https://manati.star.nesdis.noaa.gov/ascat_images/cur_25km_METB/zooms/">

    <Region Name="Cape Cod ASCAT B">

  <Map Url="WMBas85.png"Contents="Metop-B ascending"Area="85" />

  <Map Url="WMBds85.png"Contents="Metop-B descending"Area="85" />

      <Area Name="85"lat1="38.889N"lat2="51.082N"lon1="75.183W"lon2="59.822W" />

    </Region>

    <Region Name="Bermuda ASCAT B">

      <Map Url="WMBas86.png"Contents="Metop-B ascending"Area="86" />

      <Map Url="WMBds86.png"Contents="Metop-B descending"Area="86" />

      <Area Name="86"lat1="28.9871N"lat2="40.810N"lon1="75.1843W"lon2="59.8349W" />

    </Region>

  </Server>

  <Server Name="ASCAT C"Url="https://manati.star.nesdis.noaa.gov/ascat_images/cur_25km_METC/zooms/">

    <Region Name="Cape Cod ASCAT C">

      <Map Url="WMBas85.png"Contents="Metop-C ascending"Area="85" />

      <Map Url="WMBds85.png"Contents="Metop-C descending"Area="85" />

      <Area Name="85"lat1="38.889N"lat2="51.082N"lon1="75.183W"lon2="59.822W" />

    </Region>

    <Region Name="Bermuda ASCAT C">

      <Map Url="WMBas86.png"Contents="Metop-C ascending"Area="86" />

      <Map Url="WMBds86.png"Contents="Metop-C descending"Area="86" />

      <Area Name="86"lat1="28.9871N"lat2="40.810N"lon1="75.1843W"lon2="59.8349W" />

    </Region>

  </Server>

</OCPNWeatherFaxInternetRetrieval>


and here are the coordinates we need to add to the coordinates file:


<Coordinate Name="ASCAT B - Cape Cod ASCAT B - 85"X1="0"Y1="650"Lat1="38.889"Lon1="-75.183"X2="740"Y2="0"Lat2="51.083"Lon2="-59.822"Mapping="Mercator"MappingMultiplier="1.0000"MappingRatio="1.000" />

<Coordinate Name="ASCAT B - Bermuda ASCAT B - 86"X1="0"Y1="650"Lat1="28.987"Lon1="-75.184"X2="740"Y2="0"Lat2="40.810"Lon2="-59.835"Mapping="Mercator"MappingMultiplier="1.0000"MappingRatio="1.0000" />

<Coordinate Name="ASCAT C - Cape Cod ASCAT C - 85"X1="0"Y1="650"Lat1="38.889"Lon1="-75.183"X2="740"Y2="0"Lat2="51.082"Lon2="-59.822"Mapping="Mercator"MappingMultiplier="1.0000"MappingRatio="1.000" />


<Coordinate Name="ASCAT C - Bermuda ASCAT C - 86"X1="0"Y1="650"Lat1="28.987"Lon1="-75.184"X2="740"Y2="0"Lat2="40.810"Lon2="-59.835"Mapping="Mercator"MappingMultiplier="1.0000"MappingRatio="1.0000" />


The programmer can get these values from the dimensions of our file size, which is always the same at 640 height and 740 width, using the data we provide in our KML files, which in these two cases are: 


<?xml version="1.0" encoding="UTF-8"?>

<kml xmlns="http://www.opengis.net/kml/2.2"xmlns:gx="http://www.google.com/kml/ext/2.2"xmlns:kml="http://www.opengis.net/kml/2.2"xmlns:atom="http://www.w3.org/2005/Atom">

<GroundOverlay>

<name>Bermuda ASCAT B Ascending</name>

<color>7affffff</color>

<Icon>

<href>https://manati.star.nesdis.noaa.gov/ascat_images/cur_25km_METB/zooms/WMBas86.png?</href>

<viewBoundScale>0.75</viewBoundScale>

</Icon>

<LatLonBox>

<north>40.81048097146506</north>

<south>28.98713385708333</south>

<east>-59.83499451605183</east>

<west>-75.184380929696</west>

</LatLonBox>

</GroundOverlay>

</kml>


<?xml version="1.0" encoding="UTF-8"?>

<kml xmlns="http://www.opengis.net/kml/2.2"xmlns:gx="http://www.google.com/kml/ext/2.2"xmlns:kml="http://www.opengis.net/kml/2.2"xmlns:atom="http://www.w3.org/2005/Atom">

<GroundOverlay>

<name>Cape Cod ASCAT B Ascending</name>

<color>7affffff</color>

<Icon>

<href>https://manati.star.nesdis.noaa.gov/ascat_images/cur_25km_METB/zooms/WMBas85.png?</href>

<viewBoundScale>0.75</viewBoundScale>

</Icon>

<LatLonBox>

<north>51.08285287270985</north>

<south>38.88930541210142</south>

<east>-59.82222792454112</east>

<west>-75.18387376026712</west>

<rotation>-0.5009419918060303</rotation>

</LatLonBox>

</GroundOverlay>

</kml>


Note that ascending and descending for both B and C are the same dimensions, although the files have different, systematic names. The file number changes, here 85 vs 86, and the term METB changes to METC, plus the ascending vs descending changes from WMBas85 to WMBds85.


Here is what we see when we append the new ASCAT servers into the NAVY retrieval file and also append into the stock coordinates file the four listed above:


Viewing ASCAT winds in OpenCPN


My guess is that one of the talented developers that contribute to OpenCPN could download all 48 of our ASCAT regions and then write custom code to open each one and generate the right retrieval and coordinate statements to make it work for all of this data.  I also guess that this would not take too long. We have spent a large amount of time  in creating what we have, with the hopes that the rest will go very fast.


In the meantime, if someone could benefit from this data before that happens, the process can be created manually as we have done here. 


Loading Surface Analysis Graphic Maps into qtVlm

$
0
0

 After spending some time trying to build a KML file that would reproduce OPC graphic maps in qtVlm, I have had to give up for a while on this. We used it successfully for the small (~150 nmi square) regions for presenting ASCAT data, but for large areas, it seems the KML format will not inherently reproduce a mercator projection. So that explains why, for now, we are not doing this with KML files which would in principle bring the map link and the georeferencing info into qtVlm in one easy step.

Instead, we have a couple of relatively easy steps that must be done just once, and then they are saved for later use.

Here we want to automatically load the latest Atlantic surface analysis georeferenced into qtVlm, so it looks like this:

To do this use menu Gribs/Weather images/Open a weather image  and then choose a tab (1 to 8) that looks like this.

In the "File name" field type this link: https://ocean.weather.gov/A_sfc_full_ocean_color.png

and then set the other parameters as shown below.


_____________________________________________________


To do this for the Pacific to look like this:


Choose another tab (2 in this example)

In the "File name" field type this link: https://ocean.weather.gov/P_sfc_full_ocean_color.png

Note the file name is the same except for P for Pacific vs A for Atlantic 

and then set the other parameters as shown below, which are also the same except for the location of the top left corner coordinates.


_____________________________________________________

With one of these images in view, which are vetted by professional human meteorologists, you can over lay a numerical weather model forecast at the same time to evaluate it since it has not been vetted by humans.


In this case we see near perfect agreement that the OPC maps are more and more looking just like the 00h forecast of the GFS, meaning in large part that the GFS is pretty good.  But despite not learning more about the lay of the isobars and hence winds, we do see from the maps where the fronts are located;  fronts are not shown in the GFS model outputs we get in grib format.


Measure the Eye Relieve of a Sextant Scope

$
0
0

The question came up today of the eye relief of the 7 x 35 monocular we sell for taking sun sights with more precision—it is also valuable for more accurate index correction measurements. Eye relief is the
distance from the eye to the front face of the lens in the sextant eye piece. With the eye at that distance from the lens, we see the full view of the telescope without distortion. Closer or farther offers some distortion around the fringe of the view. An adequate eye relief is valuable for mariners who must wear glasses when taking a sight. 


In principle the manufacturers of the instrument should provide this spec,  but we notice that most do not for sextant scopes. Therefore we looked into the procedure for measuring this and report it here.  If the published procedure is correct, then this is a fairly easy measurement that can be made to within ± a couple mm.

Procedure: 

1) Find the exit pupil diameter by dividing the objective lens diameter by the magnification. We have a 7 x 35 scope, so this is 35/7 = 5 mm exit pupil.

2) draw a circle of this diameter on a paper and shine a light into the objective lens to view it on the paper below, as shown.


There is some distortion in this image which looks like 5.5 mm but it was drawn with needle tip dividers to more exactly 5.


Here a light shines down through the scope making a bright pattern, then the scope is moved up and down until the image just matches the exit pupil.


Here is the view just before alignment. The scope has to go down slightly to make the light pattern match the exit pupil diameter ring.


Once the light pattern is aligned with the ring, we measure the distance from eye piece to paper


This turned out to be just under 10 mm. 

Next we measure the depth of the lens inside the eye piece using two crossed tongue depressors.


This is very close to 7 mm.

Thus the total distance from eye piece lens to eye is 10 = 7 = 17 mm, which is the eye relief of this instrument.

In short when using this monocular, you would want the surface of your eye to be about 1 cm away from the lip of the eye piece, which seems about what it is when using this scope, which typically calls for pressing the eye against a large eyecup placed on the eyepiece.  At sea we need that extra point of stability plus no light in from the side.

This might be as good a place as any to note that we have known mariners to make a custom set of glasses for taking sights. They remove the lens and frame on the sextant eye so it can press up against the cut and leave a lens on the other side for seeing around them.


Reducing Station Pressure to Sea level pressure

$
0
0


The following is taken from The Barometer Handbook By David Burch. All references are to that text.


Recalling that the vertical rate of pressure change is always thousands of times higher than the horizontal rate that creates the wind and weather we care about, it is easy to see that observed pressures at various elevations must be carefully normalized to sea level if we are to learn about the true pressure pattern at hand.

In this section we outline how meteorologists determine sea level pressures from the reports they receive from varying elevations. We do not have call to do this ourselves very often, but the procedures are here if you care to. To be more precise, this is how meteorologists used to do it, based on  procedures  specified in detail in the Manual of Barometry (WBAN).  These procedures give some insight into the physical  factors that contribute to the reduction, but in practice today they use a much more empirical method, covered at the end of this section.

Step one is to clarify the concept of sea level pressure at, for example, a high plateau located inland, far from the sea—or even far from anywhere whose elevation might be near sea level. This is certainly an abstract concept, but one that is needed to normalize the observations.

The procedure is to imagine a large hole in the ground at the elevated station that reaches down to sea level. Then the question reduces to estimating what the pressure would be at the bottom of this hole based on the pressure we read at the elevated station level, along with the temperature and dew point of the air at the station level.

We know the weight of the air from the station level on up to the top of the atmosphere. That is just the station pressure we observe. So the problem reduces to figuring out how much the fictitious air column weighs in the fictitious hole.

An easy way to approximate the answer is to assume the air in the hole behaves exactly like the International Standard Atmosphere (ISA). Then we can just go to Table A2 and look up the answer. For example, consider being at an elevation of 1,200 feet above sea level. From Table A2 we see that this elevation corresponds to a pressure drop of 43.2 mb in the standard atmosphere. So if our actual station pressure were 985.5 mb, we would estimate that the pressure at sea level was 985.5 + 43.2 = 1028.7 mb.

This approximation assumes the air in the hole has exactly the average properties of the standard atmosphere. This is unlikely to be true, and we could even know this ahead of time by comparing the station pressure and temperature with the standard atmosphere values at our elevation. We can improve on this ISA approximation significantly, but it takes some number crunching to do so.

The weight of the air in the hole depends on the density of the air, which in turn depends on the average temperature of the air column as well as the moisture content—the ISA assumes dry air (relative humidity = 0%). For a better estimate of the weight of the air column, we need a better estimate of the average temperature of the air column. A complicating factor is the amount of water vapor in the air. This not only changes the density of the air directly, it also affects how the temperature changes with increasing elevation.

The standard way to simplify these calculations is to define the “virtual temperature” (Tv) of moist air  as the temperature that dry air must have in order to produce the same pressure and density the moist air has. The definition is illustrated in Figure A3-1.


We can then study the properties of a column of moist air as if it were dry air by replacing the average temperature with an average Tv. The formula for Tv depends on the station temperature, pressure, and dew point. In principle, each equation in Chapter 9 on altimetry that contains a T, should have that T replaced with Tv for the most accurate results. We will calculate this Tv in a moment, but first a more basic practical matter.

We will need a measurement of the station pressure if we are to find the sea level pressure. If you have actually measured the station pressure yourself, then you are done. That is the one you will use. But if you are testing this procedure of reducing station pressure to sea level pressure by analyzing data from another location, you still need the station pressure at that location, but you will soon learn that information may not be available. With the exception mentioned at the end of this section, station pressures are rarely reported. What they do, instead, is automatically reduce the station pressures to sea level pressures and report those. All airport reports, however, always compute the altimeter setting, discussed in Chapter 9. The reports are called “Metars,” derived from a French phrase meaning weather reports from airports.

Altimeter setting, by definition, depends only on the station pressure and elevation of the station, so we can unfold the altimeter setting (AS) to get the station pressure (Ps) we need from the equation:

Ps =[AS0.1903 - (1.313 x 10⁻⁵) x H]5.255,

where H is the station elevation in feet. This is the hypsometric equation with the temperature replaced with the ISA lapse rate. AS is given in inches of mercury, so Ps will be inches of mercury as well, but we can convert to mb as:

Ps (mb) = 33.864 x Ps (inches)

The above two equations are not from the WBAN procedures, but taken directly from NWS computer code. I apologize for the mixed units necessary if we use the exact equations presented in both methods.

 Once we have the station pressure, we can proceed with the WBAN procedure by computing the virtual temperature of the air. Start with finding the vapor pressure of the air (e) in mb from:

e = 6.11 x 10E

where e is in mb, 

E = 7.5 x Td/(237.7 + Td), 

and Td is the dew point of the station air in °C. Then we can find Tv in °K from:

Tv = (Ts + 273.15)/[1 - 0.379 x (e/Ps)]

where e and Ps are in mb, and Ts is the station air temperature in °C. The factor of 0.379 is the ratio of molecular weights of water to air. 

The Ts, as always, takes special care. It is the temperature of the air at the station elevation, but not at the time the station pressure was measured. This Ts should be the average of the temperature at the time of the pressure measurement and the temperature at the station 12 hours earlier. Add the two and divide by 2. It has been found over the years that this accounts for the small, but detectable diurnal variation of the pressure (Table 5.6-1). This whole process is an attempt to do the best at a difficult task, so every factor counts. 

Once we have Tv at the station level, we need to figure the average Tv in the fictitious air column. At this point we fall back on the ISA for an estimate of how the temperature changes in the fictitious air column. To find the mean virtual temperature (Tmv) in °K use the ISA lapse rate to get:

Tmv = Tv + [273.15 + 0.0065 x (H/2)].

Now we rewrite the hypsometric equation from Chapter 9 for the sea level pressure P1 = Psl, P2 = Ps, with Z1=0 and Z2 = H = height of the station in meters as:

Psl = r x Ps, 

where

r = exp[ H / (29.28980 x Tmv)].

r is a fraction with no units, called the “pressure reduction ratio.” H must be in meters and Tmv in °K. Recall °K = °C + 273.15°.

This can be thought of as the basic solution. As an example, check data from Table A2, such as H = 600 m, Ts = 11°C (in dry air Tv=Ts), with Ps = 942.1 mb. Then you should find that Psl = 1013.25 mb, since we used the ISA values. Change Tv to 2°C to get 1015.6 mb or use 20°C to get 1011.0 mb. If you assume the relative humidity of that 20°C air is 75%, then the dew point is 15.4°C, and this will yield Tv = 22.1°C, which in turn would imply Psl = 1010.5 mb. The humidity correction is more important in warm air than in cold.

This basic solution is the one generally used for stations below 50 meters elevation in the WBAN procedure. For higher stations two more corrections are made. First the height H is converted to a geopotential height (Hgp), because the weight of the air depends on gravity, and the strength of the gravitational force varies with latitude and with elevation. This is a very small effect, but it can adjust a high elevation by several meters, which could have an effect on the pressure that is larger than what the humidity does. Samples of geopotential corrections are given in Table A3-1. It is made up of two terms. The latitude factor increase H with increasing latitude, whereas the elevation factor decreases it with increasing elevation. 


Finally there is what is called the “Plateau Correction” to the temperature, which can be a significant correction of up to 10°C or more to Tv, leading to large changes in Psl for high elevations in extreme temperatures. The correction was first proposed by William Ferrel in 1886, which is more evidence of his genius. His reasoning and reckoning still apply today, though there have been improvements to this overall process since then. 

Ferrel noted that average summertime sea level pressures deduced at high elevations were too low, and average wintertime sea level pressures were too high, compared to averages from around the country determined at lower elevations. When deduced at high elevations, the summer-winter difference in average sea level pressures was about 10 mb higher than from stations closer to sea level. In other words, he noted an effect that was obviously caused by the land within a process that was supposed to remove the effects of land. And so a correction was called for.

He concluded that the effective lapse rate must be different when the high land is present from what it would be if the land were removed. In short, the practice of using the ISA lapse rate for the fictitious air column was not right, and the seasonal average sea level pressure differences gave him a way to estimate a correction.

He formulated his correction to be applied to the sea level pressure itself as:

Correction (mb) = 0.064 (Ts-Tn) ( H/1,000),

where H is elevation in feet, Ts is the station temperature, and Tn is the annual average temperature at the station, both in °C. Thus an air temperature that is 20°C higher than the average temperature at an elevation of 5,000 ft would add 6.4 mb to the sea level pressures. This correction smooths out the seasonal differences seen in average sea level pressures across the land.

By 1900 it was recognized that this correction could be improved by reformulating it in terms of adjustments to the lapse rate itself, yielding a more accurate mean virtual temperature. In modern times, each weather station over 50 meters high reporting sea level pressures has its own Plateau Correction factor it uses to optimize the reduction to sea level. Samples are presented in Table A3-2 for stations above and below 1,000 ft elevation.


The Plateau Correction is called F(s) as a reminder that it depends on the station. It is applied to Tmv as:

Tmv —>Tmv + F(s).

Ferrel had developed one of the first ways to decide if the “sea level pressures” over elevated lands were correct. He also looked, as others did and still do, at neighboring stations that might be at lower elevations to compare their sea-level results to seek a uniform flow of the sea-level isobars.

 Another evaluation used today is to plot out the sea level isobars predicted by the sum of all the station reports, and then compare the wind speeds and directions they predict with what is actually observed. In one sense, this is the ultimate test. We want the isobars so we can predict the wind, and if we do get isobars that predict the wind properly then we are doing a good job of measuring and deducing the isobars.

In modern meteorology there is still another crucial way to evaluate the reduction process and that is to compare the measured isobars with those predicted by any of several computerized atmospheric models. The models predict many properties of the atmosphere, at many levels of the atmosphere, not just at sea level. To the extent these other predicted properties agree with the observations, we want the  predicted isobars to agree with observations as well. 

If a model, for example, reproduced the isobars and other properties of the atmosphere over low lands very well, but over high lands or steep slopes the predicted isobars did not agree, but still other predicted properties of the atmosphere did agree, then we could consider that maybe the model is right and the way we are deducing the isobars in these difficult regions is not yet optimized. In short, the interplay between model predictions and deduced sea level pressures is yet another way to evaluate the process, and one that is actively pursued at present. 

Figure A3-2 shows samples of how the station pressure reduction constants might be evaluated with model computations to get the most useful set of sea level isobars.


Sample Pressure Reduction

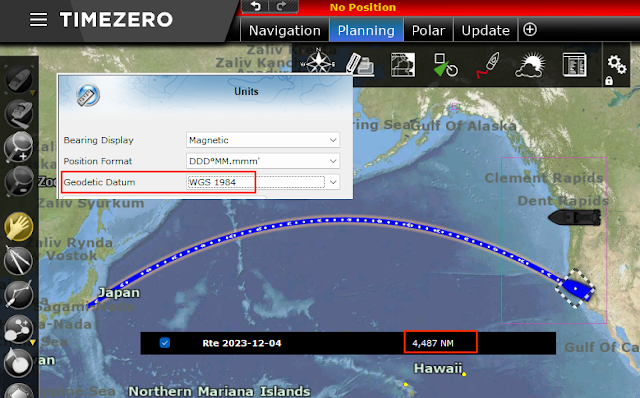
KCOS is Colorado Springs, CO, station elevation 6171 ft (1880.9 m), latitude = 38.8°N gave this Metar report: “101554Z AUTO 05005KT 10SM SCT020 OVC029 08/03 A3017 RMK AO2 SLP194 T00830028 TSNO. Observed 1554 UTC 10 May 2009, Temperature: 8.3°C (47°F), Dewpoint: 2.8°C (37°F) [RH = 68%], Pressure (altimeter): 30.17 inches Hg (1021.8 mb) [Sea level pressure: 1019.4 mb]”


The question is, how did they get the reported sea- level pressure of 1019.4?  

WBAN Procedure

Step (1). Find the reported station temperature from 12h earlier, which is: Observed 0354 UTC 10 May 2009, Temperature: 9.4°C (49°F), and from this figure the average station temperature. Ts = (9.4+8.3)/2 = 8.9°C = 48°F.

Step (2). From the altimeter setting (30.17) and elevation (6171 ft), find the station pressure Ps = 24.03” = 813.8 mb.

Step (3). From Ps (813.8 mb), Ts (8.9°C), and Td (2.8°C), find virtual temperature Tv = 9.8°C = 283.0°K

Step (4). From H = 1880.9 m (6171 ft) at Lat = 38.8 N and Table A3-1, find geopotential height Hgpm = 1880.5 m.

Step (5). From Hgpm (1880.5 m), Tv (9.8°C) find mean virtual temperature Tmv = 15.9°C = 289.1°K

Step (6). From Ts (8.9°C = 48°F) and interpolation of Table A3-2, find Plateau Correction F(s) = -7.4 F° = -7.4 x (5/9) = -4.1 C°. Note the correction is a temperature interval, not a temperature.

Step (7). From corrected Tmv (15.9 - 4.1 = 11.8°C) and Hgpm (1880.5m) find r = 1.2527, and using Ps = 813.8 we find Psl = 1019.4 mb.  

This agrees with the Metar report, but the result  is very sensitive to which values are rounded at which stage of the computation. Changes could lead to variations of ±0.2 mb.  Multiple tests from various stations would have to be done to see how well this historic method compares to the modern method used in the U.S. NWS. Other nations use other procedures.


ASOS Procedure

Starting sometime around 1992, the NWS in collaboration with the Federal Aviation Administration and the Department of Defence initiated an Automated Surface Observations System (ASOS) to collect and distribute weather data around the country. The data are collected by high precision sensors and then evaluated and analyzed by software at the stations, which are then transmitted to the various agencies and made available to the public.

Atmospheric pressure measurements are of course a crucial part of the program. Each station includes multiple electronic pressure sensors, which are compared to each other continuously. From the measured pressure at known elevation, along with the temperature and dew point, the ASOS software computes: station pressure, pressure tendency, altimeter setting, sea level pressure, density altitude, and pressure altitude.

The station pressure and altimeter setting are determined from the sensor pressures independently, but they are related as mentioned earlier. Since they are computed independently, you will find times when the equation given does not relate them exactly as they are published. You can find station pressures,  altimeter settings, and sea level pressures to practice with and compare at this link

http://www.wrh.noaa.gov/mesowest/getobext.php?table=1&wfo=lox&sid=KCOS

by changing the last 4 letters to the Metar of interest.To find the closest Metar to your location you can use www.starpath.com/barometers. To find the specifications of the station (elevation, location, ID, even accuracy!) go to (with correct metar):

https://weather.gladstonefamily.net/site/KCMI.


The ASOS procedures have simplified the WBAN procedure significantly, and after crunching numbers with the latter procedure for some hours it is easy to appreciate the virtue of this approach. They no longer use mean virtual temperatures or plateau corrections, but instead simply define the sea level pressure as

Psl = Ps x r + C,

where r is the pressure reduction ratio and C is the pressure reduction constant. A station will use either r or C, but not both. Typically stations below 100 ft would use C, in which case r = 1. C is then basically the ISA correction, perhaps adjusted to some extent for the location. It does not depend on temperature.

Higher stations use r values (C = 0) from a table of values stored in the local ASOS computer that are unique to that station. A sample for KCOS is shown in Table A3-3. Using this table, and Ts = 48°F,

Psl = 813.8 x 1.2526 = 1019.4 mb,

which is obviously easier to obtain than using the WBAN procedure—if we happen to know the official r factors. At least for now, these do not seem to be public information, so the WBAN method is the only guideline for making these reductions at arbitrary locations. Even with that, we must make some estimate of the Plateau Correction based on WBAN values. 


See also our related note where we show it is important to use the 12-hr average temperature.


Great Circle Distance — The Three Options

$
0
0

The great circle (GC) route is the shortest distance between two points on the globe, so we must always keep it in mind when planning an ocean crossing, even if we do not end up following that route. 

The GC route is defined by cutting the earth with a plane that goes through the departure (A), the destination (B),  and the center of the earth (C). That plane cuts the earth in half, and the points A and B lie along a circle (a great circle) whose circumference is the circumference of the earth, and the track along that line from A to B is called the great circle route.  If the plane does not go through the center of the earth, you also get a circle where it intersects the earth, but its circumference will be smaller than that of a great circle.


Distance along a great circle is measured  in nautical miles, which is a unit that was invented for just this purpose. Namely, the full great circle spans 360º, and each degree is 60', so a nautical mile (nmi) is defined as the length of 1 arc minute (1') along the circumference of a great circle of the earth. 

This is very convenient for navigation if we consider the great circle between the north pole, earth center, and south pole, which is a meridian of longitude. Arc minutes along this great circle are minutes of latitude.  Thus a navigator knows immediately if they are to sail from Cape Flattery, WA at about Lat 48 N to San Francisco at about Lat 38 N, they must go 10º of Lat or 600 nmi. Every 1' of Lat = 1 nmi.

There are other implications of this definition that are integrally related to the topic at hand.  For one, this assumes the earth is a sphere... which is not too radical an idea, having been known — or believed to be true — by every educated person on earth except Christopher Columbus for over a thousand years

As it turns out, the earth is not a perfect sphere, it is squashed a bit at the poles, as we might slightly compress a beach ball into more of a doorknob shape. Consequently a nautical mile cannot be simply defined as 1' of Lat, because the length of 1' of Lat changes slightly with latitude on this non-spherical shape. That simple definition is reserved for the less precise term sea mile, which is defined as 1' of Lat at a constant Lon. But nautical mile is the official international unit of global navigation so it has to have a definition, and that was given to it 1929: 1 nmi = 1852 meters, exactly.

That definition then tells us what we mean by spherical earth, based on the geometry of a circle. Namely, the circumference (c) of a circle = 2 𝜋 x radius (r) of the circle. Thus we have for spherical earth, c = 2 𝜋 r = 360 x 60 x 1.852 km, or solving for r:

r (spherical earth) = 360 x 60 x 1.852 /(2 x 3.141) = 6,367.9 km.

Thus we are at the first of three types of great circle distance computation, which is assume the earth is spherical with a radius of 6,367.9 km, which makes 1' on the circle = 1 nmi and we can use spherical trigonometry to compute the great circle distance (d) between point 1 and point 2, namely:

Cos(d) = Sin(Lat1) x Sin(Lat2) + Cos(Lat1) x Cos(Lat2) x Cos(Lon2 – Lon1).

This formula can be solved with an inexpensive trig calculator, and indeed this is the solution we would see in many calculators or apps, especially those that are largely celestial navigation oriented, because cel nav assumes the earth is a sphere as defined above.

If we use this method to compute the GC distance between San Francisco (37.8N, 122.8W) and Tokyo (34.8N, 139.8E) we would get 4,473.61 nmi.

But it is not just cel nav apps that use this equation. The Bowditch computations also assume this same 1' = 1 nmi spherical earth, and present the same value.

Besides cel nav focused apps, some chart navigation apps, officially referred to as electronic charting systems (ECS), also use this spherical earth solution, such as Rose Point's Coastal Explorer. We might call this traditional radius, the cel nav radius (6,367.9 km).


But if we open another popular ECS like qtVlm, and ask for the GC distance between these two points we get a different answer, 
namely 4,476.62 nmi. 


We see essentially the same answer in OpenCPN.


It is not just qtVlm and OpenCPN (two popular free ECS),  other computer or mobile nav apps might show this answer for these two points.

...that is, unless we are looking at a GPS chart plotter app or a handheld GPS unit with routing options, such as the Garmin GPSmap 78 shown below. 


In this case, we get a still different value of this same "great circle distance," namely 4,486.7 nmi. 

We also see this value in the ECS TimeZero.


In short, we have three values for the "great circle" distance between SF and TKY, and the one we get depends on how or who we ask. The differences in these example spans 13.1 nmi — and this, in an age where we pride ourselves with a GPS that gives our position accuracy to about a boat length or two (± 0.01 nmi).

Navigator's do not like inconsistent information, and will usually stop to figure out the source of the discrepancy. This note is intended to help with that.

The three values we noted were presented in increasing accuracy, which is tied to the shape of the earth that was used to compute the value. In most cases, these differences do not have a practical affect on navigation, but it is good to know if something is working right or not, and to understand what we see.

Type 1.  SF to TKY = 4,473.61 nmi. Spherical earth with 1' = 1 nmi. This solution is used in cel nav and other apps, as noted. Earth radius used is 6,367.9 km. The cel nav radius.

Type 2. SF to TKY = 4,476.62 nmi. This is what we would see in selected ECS that want to improve on the accuracy by using an improved earth radius. 

An improved earth shape is more of an oblate ellipsoid (doorknob), which can be approximated with a new spherical earth, but now using the average of the polar and equatorial radii, as shown. This improved method still computes the distance as a spherical earth, but uses this slightly smaller average radius of 6,371.0 km. This can be called the WGS84 average radius.


WGS84 earth dimensions. Keep in mind the scale. The equatorial bulge (7 km)  is just 0.1% of the radius; the depression of the poles (15 km), just 0.2%. The earth is actually pretty spherical.


Type 3.  SF to TKY = 4,486.7 nmi. Is in principle the most accurate solution as it uses not assume a spherical earth shape, but computes the distance along the surface of an oblate ellipsoid, the size and shape of which we get from the geodedic datum we have selected, such as WGS84. We will get this (Type 3) solution in most apps or hardware that lets us choose the horizontal datum, such as any GPS unit, hand-held or console chart plotter. This choice is actually an important thing to check in your GPS to be sure it matches your nautical charts; most should default to WGS84.


We also get this geodetic or ellipsoidal solution for "great circle" distances in several popular computer based ECS, such as TimeZero.


Google Earth will also give this value, but for other locations you may get different results as they may use different datums for different locations, which we do not seem to have control over. (The same is true, by the way, for the elevation data set or model it uses for different parts of the world. It is likely the best we can conveniently come by, but we will not know the details.)


Numerical values of these distances can be checked online with the
Jack Williams calculators.


These values can be used to determine what type of computation your device is doing. Use Departure = (37.8, -122.8); Destination =  34.8, 139.8). 
Then check for the GC distance between them.

4473.6 means spherical earth using the cel nav radius (6,367.9 km)
4476.6 means spherical earth using the WGS84 average radius (6,371.0 km)
4486.7 means a WGS84 ellipsoidal computation

A consequence of a true ellipsoidal computation means a nominal, long-distance great circle estimated position depends on which way you are headed. Consider starting from the equator at 130 W and traveling 50º N versus 50º E. Sailing along the surface of a spherical earth, the distance you travel would be the same in both directions, namely 3,000 nmi. But sailing on the surface of an oblate ellipsoid, this is not the case. You have a smaller radius going toward the pole than you do going along the equator. Going north you sail 2,991.8 nmi but sailing east you go 3,005.4 nmi.


How to Remember the Equation of Time

$
0
0

On Valentine’s Day, February 14, the sun is late on the meridian by 14 minutes (LAN at 1214); three months later, it is early by 4 minutes (LAN at 1156). On Halloween, October 31, the sun is early on the meridian by 16 minutes (LAN at 1144); three months earlier, it is late by 6 minutes (LAN at 1206).

These four dates mark the turning points in the Equation of Time. You can assume that the values at the turning points remain constant for two weeks on either side of the turn, as shown in Figure 12-7. Between these dates, assume the variation is proportional to the date.


There is some symmetry to this prescription, which may help you remember it:

14 latethree months later goes to4 early

16 earlythree months earlier goes to6 late

but I admit it is no catchy jingle. Knowing the general shape of the curve and the form of the prescription, however, has been enough to help me remember it for some years now. It also helps to have been late sometimes on Valentine’s Day! An example of its use when interpolation is required is shown in Figure 12-7.

The accuracy of the prescription is shown in Figure 12-8. It is generally accurate to within a minute or so, which means that longitude figured from it will generally be accurate to within 15′ or so.


This process for figuring the Equation of Time may appear involved at first, but if you work out a few examples and check yourself with the almanac, it should fall into place. If you are going to memorize something that could be of great value, this is it. When you know this and have an accurate watch, you will always be able to find your longitude; you don’t need anything else. With this point in mind, it is worth the trouble to learn it.

Also remember that the LAN method tells you what your longitude was at LAN, even though it may have taken all day to find it. To figure your present longitude, you must dead reckon from LAN to the present. Procedures for converting between distance intervals and longitude intervals are covered in the Keeping Track of Longitude section below.

For completeness, we should add that, strictly speaking, this method assumes your latitude does not change much between the morning and afternoon sights used to find the time of LAN. A latitude change distorts the path of the sun so that the time halfway between equal sun heights is no longer precisely equal to LAN. Consider an extreme example of LAN determined from sunrise and sunset when these times are changing by 4 minutes per 1° of latitude (above latitude 44° near the solstices). If you sail due south 2° between sunrise and sunset, the sunset time will be wrong by 8 minutes, which makes the halfway time of LAN wrong by 4 minutes. The longitude error would be 60′, or 1°. But it is only a rare situation like this that would lead to so large an error. It is not easy to correct for this when using low sights to determine the time of LAN. For emergency longitude, you can overlook this problem.

In preparing for emergency navigation before a long voyage, it is clearly useful to know the Equation of Time. Generally, it will change little during a typical ocean passage. Preparing for emergency longitude calculations from the sun involves the same sort of memorization required for emergency latitude calculations. For example, departing on a planned thirty-day passage starting on July 1, you might remember that the sun’s declination varies from N 23° 0′ to N 18° 17′ and the time of LAN at Greenwich varies from 1204 to 1206. Then, knowing the emergency prescriptions for figuring latitude and longitude, you can derive accurate values for any date during this period.

This article is taken from Emergency Navigation by David Burch

Special Uses of the Star Finder and Sight Reduction Tables

$
0
0

The 2102-D Star Finder is essentially a hand-held planetarium designed for mariners to assist with celestial navigation. It can be used to plan the best sights as well as its main function which is to identify stars or planets whose sights have already been taken. We have devoted a short book to the many uses of this powerful tool called The Star Finder Book.

Sight reduction tables are permanent mathematical solutions to the Navigational Triangle that form the backbone of celestial navigation carried out in the traditional manner using books and manual plotting — as opposed to modern solutions using computers or calculators with dedicated cel nav apps.

There are several styles of these tables, popular versions are called Pub 229, Pub 249, and the NAO Tables, a copy of which is included in every Nautical Almanac. Complete free copies are available online as free downloads, which are good for practice, but do not make sense for use underway because any device that can read the files can also support a cel nav app that does the full process, sights to fix.

All sight reduction tables, regardless of format, do the same thing. You enter the tables with three angles and come out with two angles. We enter with the declination (dec) and local hour angle (LHA) of the object sighted and the assumed latitude (a-Lat) of the observer, and we come out with the angular height of the object (Hc) and its direction (Zn) as seen from the assumed position.

Put in plainer terms, the Almanac tells us where the sun and moon, stars and planets are located at any time of the year, and the sight reduction tables tells us what the height and bearing of any one would be as seen from any latitude and longitude.... or it tells us the object is below the horizon at that time and place.

The Star Finder does exactly the same thing, but with less accuracy. We look up in the Almanac a number that tells us how to set up the disks for the time and latitude we care about, and then we read the Hc and Zn of the celestial objects from the blue templates.

With that background, I want to point out that either of these tools can also be used to answer more non-conventional cel nav questions such as one that is part of our Emergency Navigation course. Part B of question 6 on quiz 5, asks us what are the conditions that lead to the sun's bearing changing with time at a rate of 45º per hour or faster?

This comes up in the context of using the "Eskimo Clock Method" to get bearings from the sun based on the local time of day, which makes the assumption that the sun's bearing moves along the horizon at the rate of 15º per hour. That condition, we show in the course,  requires the peak height of the sun at noon (Hc) to be less than 45º, which leads to the nick name "Eskimo clock," because at high latitudes the sun is always low.

Here we have a more specific related question, but it can be solved with the Star Finder or with sight reduction tables. 

We know that fast bearing changes means the object is very high and the fastest change will occur when the object passes overhead or near so. Consider sailing at lat 15º N during a time when the declination of the sun is also about N 15º (first few days of May).  [Note latitudes get the label following the value; declinations get the label preceding the value.] In this example, the sun will bear near due east (090) all morning and then change to near due west (270) in a matter of minutes as it passes overhead.  The question we have is, how do we specify the conditions that will lead to this bearing change being ≥ 45º/hr? It will have to be high, but it won't have to cross over head.

This could be worked from any latitude in the tropics, but we stick with 15º N, and look at the star Alnilam (declination about S 1º, which corresponds to the sun's declination in Sept, 19th-21st).  Below is the Star Finder set up for the time Alnilam crosses our meridian bearing due south.


Alnilam crosses the meridian bearing due south (180) at a local hour angle of Aries equal to 84.5º.  We see that the height of the star as it crosses is 74º, which we would expect in that we are at 15N and the star is at S1 so the zenith distance (z) is 15+1 = 16º which makes the Hc (90-z) = 74º. 

The rim scale corresponds to time at the rate of 15º/hr, so 30 min later (LHA Aries = 91.0º (84.5+7.5), we see that the star has descended very slightly but now has moved west.


Thirty minutes later the bearing is 205º, or 25º to the west of 180º. Thus if we imagine this star to be the sun in late Sept, viewed from 15º N, we would see its hourly change in bearing at midday to be about 50º per hour.  This is a bit faster than the exercise asked for, but we could experiment around for a closer answer.

We can also do such studies with sight reduction tables, such as Pub 249. We enter the tables with a-Lat = 15º and dec = 1º. With these tables we do not use North or South labels but just specify if they are both north or both south or is one north and one south. The former condition is called Same Name; the latter is called Contrary Name.  We have Same Name in this example.

We will also start with LHA = 0º, which means the sun is crossing our meridian (bearing 180), and like wise look at 30 min later with LHA = 7.5º. We could look at LHA = 15º, exactly one hour later, but the rate of bearing change at LHA 352.5º to 007.5º, as it crosses our meridian, is a bit faster than the full hour on either side.


In Pub 249, each Lat has a set of pages, LHA is on the side of the page, and declination is across the page. The tabulated values are Hc, d, and Z. The d-value is how much the Hc changes with 1º of declination — for Alnihlin, dec = S 1º 12', so we would reduce the tabulated Hc by 12/60 x 60 = 12' for precise values of Hc, but we can neglect Hc for present study.)

At meridian passage the bearing is 180º, then 30 min later (LHA=7.5), we see the body dropped from 74º high at the meridian to about 72º 20' at which time the relative bearing (Z) is about 154º, from which using the rule provided (Zn=360-Z) to find the new bearing of 206º, which agrees with what we found from the Star Finder.

These terms and procedures become more familiar with a full study of cel nav, but we hope the brief discussion of the principles show how these tools might be used for other questions. Note that LHA is defined as how far west of you the body is, so as it approaches from the east it has large, increasing LHA, which goes from 358, 359, 360, 1, 2, 3 as it crosses the meridian.


***


A New Revolution in Barometers

$
0
0

We have worked for many years promoting the use of accurate pressure in marine navigation, which had literally fallen out of all standard texts on marine weather twenty years ago. The word "barometer" was barely mentioned. We would see occasionally that a falling barometer means bad weather, but nothing more, and certainly nothing about how fast it must fall for bad weather. And all of these books state—they are all still in print—that the value of the pressure does not matter; it is just a question of rising or falling, fast or slow, but never with any numerical values.

Accurate pressure was crucial in the late1700s and early 1800s when much of global marine weather was first learned and understood with the aid of accurate mercury barometers used at sea. But they were unwieldy and difficult to use and happily set aside with the development of aneroid barometers in the mid 1800s. That revolution took place without the full recognition that with the great convenience of the aneroids came a notable loss of accuracy over the higher and lower ends of the dial, which typically matter the most in routing decisions—a fact that has followed aneroid use into modern times. Thus began the doctrine that only the change in the pressure matters, not its actual value.

Now it remains as it was then: only the high-end, expensive aneroid units can be counted on for accurate pressures over the full range we care about in marine navigation. I would venture to guess that most barometers on vessels today are there primarily for traditional reasons, and not referred to for routing decisions.

We began our goal to change that with the first edition of Modern Marine Weather and had gone into the interesting history of how this came about in The Barometer Handbook. Both books show how important it is to know accurate pressure to evaluate numerical weather predictions that we ultimately rely on for routing. 


Accurate pressure is also often the fastest way to detect a change in the weather or the movement of a High pressure system we are carefully navigating around. Responding to the motion of a High is often a key decision for sailors in an ocean crossing.

In the tropics, where the standard deviation of the seasonal pressure is just a couple millibars (mb), we can know from accurate pressure alone whether or not a tropical storm is approaching—and we can know this before we see notable changes in the clouds or wind. Needless to say, we navigate in such waters primarily based on official forecasts and tropical cyclone advisories, but an accurate barometer gives us early notification that forecasted storm motions are on time, early, or late. On the other hand, any loss of wireless communications makes the barometer even more important.


In the hurricane zone between Panama and Hawaii, we would expect a July pressure of about 1012 mb, with a standard deviation of 2 to 2.8 mb.  A measured pressure of 1007 mb (2.5 standard deviations below normal) has only a 0.6% chance of being a statistical variation and a 99.4% chance of being an early tropical storm warning.  This type of analysis does not work at higher latitudes because the standard deviations are much larger.

Pressure statistics needed for this type of analysis are included in our Mariners Pressure Atlas.


We developed a sophisticated electronic barograph that was quickly adopted by the NWS for use on the voluntary observing ships  (VOS). We later sold that product to another company.


To further support the use of accurate pressure, we became the US distributor for the state of the art Fischer Precision Aneroid Barometer, used by those who want the best of the best in a mechanical unit, including the Navies, Coast Guards, and Weather Service vessels around the world, including the US. Fischer is one of the last sources for accurate, hand-made aneroid barometers.

To follow up on that, we developed both a free Marine Barometer app and low-cost Marine Barograph app for iOS and Android mobile devices. 


In short, we have worked on barometers for over 20 years now, but I felt we still did not have the unit that could have the biggest impact on marine navigation, which is what lead to the development of the Starpath USB Baro.

Not all vessels can invest in the high-end units. The mobile apps, while providing a convenient backup that can indeed broadcast pressure data to a navigation program, still rely on a device that must be charged and protected. Also running it full time does put a strain on the phone's battery life.

The New Revolution

Our goal was to develop a barometer that was first and foremost highly accurate and dependable, plus we wanted it to be easily portable. Finally, we wanted to produce it at a low enough cost to be attractive to all mariners, even those using it as a backup. For mariners we also need the output signals to be in the NMEA standard to match navigation electronics and software.

The result is the Starpath USB Baro for $49, which includes a metal transport case. It can be read in any Navigation program, or use our free USB Baro app for Mac or PC.

In stock and ready to ship from the link above.

Below shows how the pressure appears in three popular navigation programs. Video setup procedures for each are shown in the link above.


We can compare this with official pressure data from the West Point Lighthouse (NDBC WPOW1), which is 1.6 nmi from where the USB Baro data were accumulated.


The red square marks the data corresponding to our measurements with the USB Baro. We can now overlay that data with what we measured, as shown below.


So, we see that with this simple device we have access to the same pressure data that NOAA relies on to make their official forecasts and numerical weather predictions.  

The difference between1023.0 mb indicated in the Lighthouse value and the 1017.2 mb observed in our office can be accounted for to the tenth of a mb, because of the elevation of the USB Baros compared to the sea level data from NOAA.  All of the Nav apps used offer the option to incorporate this offset so the instrument reads sea level pressure directly. Our free Marine Barograph apps made for the USB Baro also have that option.

Our Guarantee

If you have now a common aneroid barometer and then compare what it reads with the known accuracy of the USB Baro over a pressure variation of 30 mb or so, you will be very pleased to own the USB Baro. 

You will either show that your aneroid is accurate, effectively calibrating it, which otherwise costs $195, or you will learn that you did indeed need a more accurate source of pressure for your boat or home.

Role of the Safety Depth in ENC Display

$
0
0

When viewing an official electronic navigational chart (ENC), the user selects three depth contours (shallow, safety, and deep) and also sets one specific depth value called the safety depth. These four choices affect the colors of objects we see on the chart, as well determining several other features of the chart display.

The safety contour is the most important one as it separates what is called the safe water from the unsafe water. It will trigger alarms and it determines when isolated hazardous objects change from their normal symbol into the prominent isolated danger symbol, which is determined by the requested safety contour and not the displayed contour, which are often different. This takes some attention, but that is not the topic at hand.

We deal here with the safety depth, a simple number, not a contour on the chart, and thus something simpler than the safety contour — but not quite as simple as a first glance might imply.

The most notable effect of the safety contour is to change the color of the soundings. All soundings on the chart that are less than or equal to the user selected safety depth are shown in black, whereas all soundings deeper than the safety depth are shown in a less notable gray shade.


In this example, we wanted a safety contour of 35 ft, so we set the requested safety contour to 35 ft and also set the safety depth to 35 ft — it is generally good practice to make these equal. But in this chart there was no contour at 35 ft, so it chose the next deepest contour as the displayed safety contour, which was 60 ft. The safety contour is always shown as a bolder contour. 

Our choice to also set the safety depth to 35 ft changed all soundings deeper than that to the less prominent gray, leaving the serious ones we care about as black. In this chart, the displayed safety contour does not very well mark the waters we want to avoid, but we can now see this fairly clearly by the color of the soundings.

That is the main job of the safety depth. All soundings will respond to this color demarcation, including those that are part of another symbol.

And often, even usually, that is all that is ever said about the safety depth choice: it determines if a sounding is gray or black. We have likely even said in our own early discussions that this is what the safety depth does... "and nothing more!"

But that is not really the case. In working on our forthcoming new booklet called Electronic Chart Symbols: An Annotated ECDIS Chart No. 1, we were reminded that the all important generic hazard symbols for wrecks, rocks, and obstructions with known soundings are indeed supposed to change background color from blue to transparent when their sounding is greater than the user selected safety depth.

Below are a couple samples.


Here we have two generic hazard symbols with known soundings. These could be rocks, wrecks, or obstructions. We do not know till we cursor pick the symbols.

They have soundings of 27 and 22 ft. The cursor pick report of the right one is shown. The safety depth has been set to 20 ft, so both of these rocks are deeper 
than that so the symbol is transparent.

Now, we leave everything the same, but change the safety depth to 30 ft. In other words, we consider water 30 ft or deeper to be safe, but these two rocks are only 22 and 27 ft under the water at tide height = 0.


The effect has been to change the soundings color to black, but also notable it has changed the hazard symbol from transparent (less notable) to a blue that will always stand out.

All the common generic hazard symbols behave this way. They are all identical dotted ovals with the sounding inside. They look the same but they could be a rock, a wreck, or one of many kinds of obstructions.

Here is another example.


These five examples of submerged hazards with known soundings are all rocks, but we would not know that without cursor picking each one to get its properties. These could be wrecks or obstructions. In this view, the safety depth was set to 10 ft.

The chart samples shown here are from the free nav app for Mac or PC called qtVlm. We use it in our Marine Weather course and in our course on Electronic Chart Navigation. qtVlm has a top of the line presentation of ENC that adheres to the IHO standards on symbols and functionality. 


Choosing the Best Sextant Sights

$
0
0

 The criteria for choosing best sights is outlined in the Star Finder Book and in the manual to the StarPilot programs, but this online course has shown us that we need more specific notes on this. Again, this is the type of thing we generally covered in the classroom lectures, so it had been only sparsely covered in the printed materials to date.

The goal of sight selection is always to optimize the accuracy of the fix. If only two sights are available, then these would be ideally about 90° apart in bearing so that intersection errors are minimized. This is the same criteria used in choosing targets for compass bearing fixes in pilotage waters. If instead of 90° apart, the two targets were only 10° apart, then any small error in either of the bearings would cause a large error in the intersection when the LOPs were plotted. 

Use any chart and plot a bearing fix to two objects that are 10° apart and then repeat the plot assuming one of the lines is wrong by 3°. Look at how much the fix changes. Then do the same thing for two objects that are 90° apart at about the same distance off. When they are 90° apart the error will be 5% of the distance to the nearest mark, or something near that. But for the two close bearings the error will be much larger.

For a two-sight fix, this "scissor effect" on the shift of the intersection is minimum at 90°, but from a practical point of view, any LOP intersection angle more than about 30° will reduce most of this error enhancement, and you really don't gain much going to intersection angles above 60° or so.

The same reasoning applies to cel nav fixes. First if you are limited to two sights, then they should be some 30 or more degrees apart... ideally closer to 60 or 90. And, as always, you should take at least 4 sights of each object if you can, alternating at least the first couple of them. The reason for alternating, is to cover the situation where you just get two sights then something happens. If these are two of the same body, you are left with only an LOP, but if of different bodies you have a fix. Not the best you might have gotten, but at least a fix. For the record, I have been on two vessels where my sight taking was interrupted early in the process, and in both cases, a cel fix at the time was crucial. In the first case, the boat under spinnaker in the ocean broached on a wave, which kept us busy with immediate sailing issues even more crucial than improving the quality of the fix. In the second case, a pressure cooker exploded below decks, and the first aid issues again took precedence over the navigation. Needless to say, both of these examples are rare cases, but the goal of sound navigation is to develop procedures that cover you even in unusual circumstances. 

Figure 1. When LOPs are closer than some 30° apart, the fix errors are greatly enhanced (red lines) due to unavoidable uncertainties in the bearing lines. Here the error shown is 3°.

Also in cel nav we have limits on altitudes. Generally you would choose sights above about 15° and below about 75°. This is for two separate reasons. Low sights, especially down within say 5° of the horizon are more influenced by refraction. Refraction is the one uncertainty we do not have much control over in cel nav. We routinely make refraction corrections, but we are always vulnerable to abnormal refraction. In other words, mirages do indeed exist, and some are very prominent from the water in some circumstances. Mirages are an impressive demonstration of the presence of abnormal refraction. In the open ocean, when there is no land or vessels over the horizon to see mysteriously floating above the horizon in a mirage, we have no way to know that abnormal refraction is present, so we have to just be vigilant. There are special tables in the Nautical Almanac for correcting for abnormal refraction based on temperature and pressure, but what is not stated in these tables is the fact that the uncertainty in these corrections are about as large as the corrections themselves. Indeed, we do not even include these in our routine procedures, unless you are forced to take low sights, in which case they probably statistically would be right more often than wrong. Sights within some 5° of the horizon might be off by as much as 5 miles or so, even with the special corrections. Not always, and maybe even not likely, but definitely possible.

The best bet is to just avoid low sights whenever possible. Refraction correction is about 35' on the horizon, then 10' at 5° and 5' at 10° and then it just gets smaller as the elevation (Hs) gets larger. Look at the altitude correction for stars, since that is pure refraction.

The reason for avoiding high sights is completely different. There are two reasons for avoiding high sights. One is they are harder to take because the bodies are nearly overhead, which makes it difficult to tell which way to point the sextant as you rock it. For high sights it is easy to be misled into thinking you have the body aligned with the horizon when you do not. Hence if you do get stuck and need to take very high sights, be aware of this issue when rocking the sextant.

The other problem with very high sights is the sight reduction process itself. For high sights the LOPs cannot be accurately approximated as straight lines (which is our normal procedure), since the the circle of position now has a relatively small radius. Later we will add a section on processing high sights, for now the issue is just to avoid them if possible. If you are eventually using the StarPilot for sight reduction, then this issue is taken care of automatically, but when sight reducing and plotting by hand, we need special procedures for sights above some 75°. It is not difficult, and does not require special tables or compuations, but it is different.

Summary so far: for two sights only, choose the two bodies as close to 90° apart as possible and find bodies that are above 15 and below 75 degrees in height, and then take 4 sights of each to average for the two best LOPs. Sight averaging is covered in the course book, chapter 11.

But... with all that said, two stars (even in the right elevation range) are not the best option in the first place. Three stars are much more valuable for an accurate fix. Even if you take multiple sights of the two bodies, which reduces your statistical errors from any one measurement, you still are left with just two LOPs, the average from each set. You do get a picture from the plot of the LOPs what this level of uncertainty is — the more they are spread out the more uncertain the fix is — but you do not learn anything about systematic, or constant errors that might apply to each sight.

That is the value of choosing 3 sights that are about 120° apart. In this configuration, any constant error in each sight simply makes the triangle of LOPs (called the "cocked hat") larger, but the center of the fix remains an accurate position. This is not the case with 3 sights that are 60° apart, even though the final cocked hat of intersections might look identical. As time permits, we will add numeric examples to illustrate this important point, for now, however, the main goal is to explain the rest of the criteria beyond the geometry.

Figure 2. This is the way 3 LOPs would appear if there were no errors at all in the sights and they were reduced using the true position as the AP for each sight.

The top picture is for 3 sights taken 120° apart, the bottom is for 3 sights taken 60° apart. 

Assume that Hc = 30° 20' and Ho = 30° 20' for each sight

While the choice of geometry (selecting 3 bodies as near 120° apart as possible) will always be the dominant criteria in selecting bodies (along with above 15 and below 75° high), there are other criteria as well. The other factor is brightness. You can take more accurate sights of ones you can see clearly. So when all else is equal, or about equal, then choose the triad that includes 3 of the brightest stars. For example, if you have 3 stars that are very near 120 apart, but one of them is a magnitude 2.5 star, then you would almost certainly get a better fix from 3 that were, say, 130 and 110, 120 apart. In other words, you can tweak your choice to give up 10 or 20 degrees in optimum angle in exchange for brightness. There is a big difference in apparent brightness between a magnitude 2.3 star and a magnitude 1.5 star. See the table in the Star Finder book which coverts the magnitude scale to perceived brightness.


Figure 3. Now we show the same sights as above, but now assume there is a contstant 5' error in each sight, ie the sextant read 5' too high on each sight. We now have Hc = 30° 20' and Ho = 30° 25' for each sight, which gives a = 5' T 060, 180, and 300 for the top sights, taken 120° apart and a = 5' T 300, 000, 060 for the bottom sights taken 60° apart. They are all again reduced from the true position.

Note that the center of the top sights is still the proper fix, even with a constant 5' error, but in the bottom case, if we chose the center of the triangle as the fix, we would not get the right answer.

The main point is, we do not know what the error is, so we can't guess ahead of time where the fix should be for 3 sights 60° apart. We only know that the final uncertainty is larger than we would guess from the size of the "cocked hat" of intersections.

Once you have chosen several possible triads that have comparable quality on spacing and brightness, the final criteria would be to choose the triad that has the 3 stars at about the same height. This is again because of refraction. A star at 70° has a different refraction correction than one at 20° and if you happen to be in a case with abnormal refraction, you will magnify this effect by having stars at different heights. Again, the goal is to take advantage of the 120° geometry. If we have a refraction uncertainty, then to first approximation it will be the same error for all 3 stars if they are at about the same height. And if the error is the same for each sight, it will cancel out with the 120° geometry. We have of course removed the main effect of refraction by limiting all sights to above 15°, but this is now the third level of choice criteria, which is really fine tuning the process. The first filter kept our unknown errors below a 2 or 3', this final choice might help us get to the optimum accuracy of some 0.5' or so.... all providing we have taken into account the motion of the boat properly. 


A graphic reminder that when we have a choice, we choose sights above 15° and below 75°. Naturally, if there are no other options, we take any sights we can and keep in mind the special issues of each region.

If you do not advance all sights properly, then you loose accuracy according to your speed and time in the sight process. If I am moving at 6 kts, and take 30 minutes to do my sights, then I have a 3 mile uncertainty floating around that will mask much of this fine tuning in star choice if I do not correct for it. This again, is a virtue of the StarPilot or other computer or calculator based sight reduction. All sight reductions automatically advance all sights to the time you ask for the fix.


In the top picture, we give up a superior 120° spacing in favor of a brighter star that has fairly good spacing.

In the bottom picture, we sacrafice a bit of spacing for 3 stars at about the same altitude... or more to the point, to avoid one that is rather different than the other two.

All of these choices are fluid. The general criteria is discussed in the text, and from that you make your best choices and try options if you have the opportunity. Or take them all and do the fixes in various triad combinations to learn more of the practical matters.

For the record, in the StarPilot program, which is the only software available that actually sorts out and selects best sights from any sky, we use as a default weighted criteria: 70% on geometry, 20% on brightness, and 10% on relative altitudes, with Hc max = 75 and Hc min = 15. Each of these criteria can be adjusted by the user.

Japan Weather — A Sample of What We Can Do For All Global Waters

$
0
0

We had an excellent question come up in class asking simply what are the best weather resources for the waters of Japan?  In our textbook (Modern Marine Weather) and in our training and resources app (Weather Trainer Live) we list all resources available worldwide and even have sections on specific regions, but realize it could be valuable to just focus in and list specific solutions for a sample area, with details needed to actually obtain the data underway.

So we use Japan for this example, stressing that these same sources (or counterparts) are available for essentially any part of the world.

_____________

(1) Model forecasts in grib format
The main workhorses we use anywhere will be the global model forecasts from GFS and ECMWF.  These data are available from saildocs with an email request to query@saildocs.com with this in the body of the message:

GFS:49.00N,24.00N,120.00E,158.00E|0.25,0.25|0,3,6..72|WIND,PRMSL

ECMWF:49.00N,24.00N,120.00E,158.00E|0.25,0.25|0,3,6..72|MSLP,WIND 

These files can then be viewed in any navigation app, such as qtVlm, OpenCPN, TimeZero, Coastal Explorer,  or Expedition or in a dedicated grib viewer such as XyGrib. Background on use of gribs at the Grib School. Luckgrib is a state of the art app for downloading and viewing grib data. 

Sample model forecasts. Red is GFS, blue is ECMWF

(2) Graphic weather maps
We need to check the pure model data from above with actual maps made by human meteorologists, and we have several sources of those. 


Above is a sample surface analysis (12z Apr 28) and below is the corresponding OPC map, which is as far west as they go (135E).


(2a) Weather maps from Japan

https://www.jma.go.jp/bosai/weather_map/#lang=en

Analysis chart

24-hr forecast

48-hr forecast

These are pdfs of about 550 kb, too large for sat phones as a rule, but it won't be long till all mariners have high speed internet offshore, then this type of link becomes more valuable. In the meantime, a supporter on land can download the file, copy the image from the pdf, reduce the file size, and email it to you on the boat.

Graphic weather maps are also available by HF radiofax if your boat happens to have the SSB radio and antenna set up. Japan stations are listed in the Worldwide Marine Radiofacsimilie Broadcast Schedules.  The many JMA maps available this way are listed at the JMH radio Station.

The other important radio related resource for international voyages is the NGA Pub 117, Radio Navigational Aids.  This tells, for example, what time of day you get VHF storm and navigation warnings for different parts of Japan. NAVTEX broadcast times are also given.

HF Fax is frankly an outdated technology (replaced by satellite communications), but if we could access the folder JMA store the images in we could request the same maps by email the way we do the US maps.

(2b) US OPC maps covers NW Japan waters

US maps only go to 135E (sample above), but they could be helpful on the approach from the east. See the Starpath Pacific Briefings page for examples and links. These are easy to obtain by email from Saildocs or FTPmail.

(2c) You can see UK maps of Japan waters at

https://charts.ecmwf.int/ and choose Eastern Asia region. These maps, however, might be just their model output plotted, which does not add knowledge.

(3) Satellite cloud pics
Japan has an excellent satellite image program (Himawari). See index to files here, which is also where you learn the file name you need to ask for.

https://www.data.jma.go.jp/mscweb/data/himawari/index.html


The latest visible image (b13) for Japan area can  be requested by email from Saildocs is


https://www.data.jma.go.jp/mscweb/data/himawari/img/jpn/jpn_b13_0000.jpg.  


The last four digits are the UTC of the image, available every 10 min, i.e., 0000, 0010, 0320 etc.  Himawari data are also excellent throughout the South Pacific.


This sample image is from 2 days later than other examples shown.


(4) Near live ASCAT winds

To get near live ASCAT winds, follow articles we have online about it and use links like the following for Central Japan waters:

https://manati.star.nesdis.noaa.gov/ascat_images/cur_25km_METB/zooms/WMBas254.png

https://manati.star.nesdis.noaa.gov/ascat_images/cur_25km_METB/zooms/WMBds254.png

https://manati.star.nesdis.noaa.gov/ascat_images/cur_25km_METC/zooms/WMBas254.png

https://manati.star.nesdis.noaa.gov/ascat_images/cur_25km_METC/zooms/WMBds254.png

You can use the same set of links for Northern Japan by changing the file number to 253, and for Southern Japan use 242.  You can get these online or ask for them from Saildocs by email. For background see starpath.com/ASCAT.

Sample ASCAT pass

(5) Live ship reports
You can also get a list of all ship reports near Japan by sending a blank email to shipreports@starpath.com and put the central Lat Lon in the subject line, such as 37.0 N, 140.2 E. (See starpath.com/shipreports.) This gets a list of all the reports plus a GPX file of the reports that can be loaded into a nav app to see actual locations and data.

(6) Ocean Currents.
You can get ocean currents and SST for that region from RTOFS request to Saildocs

RTOFS:48.00N,22.00N,122.00E,158.00E|0.08,0.08|0,3,6..72|CURRENT,WTMP 

For background on currents see starpath.com/currents.

(7) Waves and sea state.
GFS is best for this, again available from Saildocs. There are many sea state parameters (see Grib School list), but these are likely of interest most often:

Significant Wave Height of the Combined Seas (HTSGW)  

Primary Wave, Direction it comes from (DIRPW)

Primary Wave, Mean Period (PERPW)

GFS:54.00N,22.00N,120.00E,164.00E|0.25,0.25|0,3,6..72|HTSGW,DIRPW,PERPW 

(8) Tropical cyclone warnings and reports
Primary source is Japan Meteorological Agency, which is also the Regional Specialized Meteorological Center (RSMC).

To get the latest Japan waters text reports from Saildocs, use send Met.11por

To see how to get reports for other parts of the large metarea XI, use send metarea

Other metareas around the world...
(9) Special sources (with thanks to Mark D'Arcy for this reminder)
JMA, like other maritime nations, has weather models of their own, but the grib format is a paid service. You can see their MSM model at windy.com, but the higher-res LFM is paid only.

Many maritime nations also have universities or other agencies that run a localized version of the Weather Research & Forecasting Model (WRF). These high-res data can be very useful when available.  Japan and South Korea have WRF data available from selected resources, such as the weather and nav app Expedition


The World Sees Atmospheric Pressure at Work

$
0
0

This week is the 30th anniversary of the opening of the EuroTunnel (Chunnel) between England and France. The BBC commemorated the event with a story about the first underground meeting of the tunnels being dug from both sides that took place 4 years before the actual opening, on Dec 1, 1990.  They met roughly mid channel, with TV cameras at hand.

The fellow on the British side with orange t-shirt is Graham Fagg who in 2010 gave a description of the event, which can be heard on the BBC Witness program. In that recording from (3:59) to (4:28) we learn that when the hole was opened up big enough to walk through there came a sudden wind from the British side to the French side that was strong enough to blow his helmet off.  That wind is the subject at hand.

This wind is quite literally what we call in marine weather a channeled wind! It means the pressure on the UK side was higher than that on the French side and the area between the two sides was confined by a narrow channel. We just have a case here of a very narrow channel, not just steep hills on two sides.

Our goal is to estimate what that wind speed was, which is an exercise in resources—meaning, can we find the actual pressures at both ends at that time, and then can we make some semi-reasonable estimates of the wind speed.

Below shows the Chunnel viewed on Meltemus charts of UK in qtVlm, with overlaid ECMWF reanalyzed surface analysis for the approximated break-though time (11 to 12 UTC, Dec 1, 1990) when the wind was noted. (The New York Times has a good article about the event, but seems to have a chauvinistic view of time keeping by not telling us the correct time zone of the event.)


The red line is the route of the Chunnel. The isobars are shown at 0.1mb spacing.  The inserts are meteogram plots of how the pressure varied throughout the day at both ends. The pressure gradient across the channel did not change from 11z to 12z, at (1036.0 - 1035.5)/26.9 = 0.5mb/26.9 nmi.

The ambient surface wind at this time was about 10 kts across the channel, but we must use wild approximations to estimate the wind in the tunnel.

We can for example just use the basic formula for wind responding to isobars that leads to the wind we see on the surface. We derive a simple formula for that in Table 2.4-1 of Modern Marine Weather:

 U = 40 kts/ [D x sin(Lat)]

Where D is the pressure gradient expressed in a special way. Namely it is the distance between 4-mb isobars expressed in degrees of Lat. On a map, we put dividers across adjacent isobars, then move that to the Lat scale. If the distance between the two isobars on either side of the point we care about is 180 nmi, then D = 3.0. 

So we have to convert our tunnel gradient to that format starting with: 0.5 mb = 26.9 nmi. 

0.5 mb x (4/0.5) = 4 mb = 26.9 nmi x (4/0.5) = 215.2 nmi = 3.58 Lat degrees (at 60 nmi per degree).

U = 40 kts / [3.58 x sin (51)] = 14.4 kts

Then for surface winds we have a surface friction reduction of 0.8 or so that leaves us with 11.5 kts, which essentially agrees with the observed surface winds—which should not be a surprise as that is the basic procedure used by the models, with a few subtle corrections.

The above is based on the physics of wind flow, but still a large stretch to project that thinking into the tunnel. It is at least a plausibility argument for the rough magnitude of  the wind.

In our textbook in Sec 6.2 on Wind Crossing Isobars (page 146) we give another way to approximate wind flow in channels that is purely empirical, meaning not computed, just observed. It is a rule we compiled based on how the local NWS forecasted wind speed (in the old days) in the Strait of Juan de Fuca and in the Puget Sound based on the pressure differences at each end of these channels. Our composite guideline is this:

Channel wind (kts) = 800 x Pressure gradient (mb/nmi),

which we can easily apply to what we know:

Channel wind = 800 x (0.5/26.9) = 14.9 kts.

So again, we see the order of magnitude of the wind speed we might expect in the tunnel.  And again, we cannot consider this rigorous science; wind flow in restrictions is very complex. We have just confirmed that indeed the wind was going the direction observed, and also about the right speed. We use this same approach to forecast or anticipate wind changes in our own waters based on pressure changes. It is part of our Local Weather web page.

There is also a psychological element of confirmation. The force of the wind is proportional to the wind speed squared. The force of 14 kts of wind is twice that of 10 kts of wind. At 17 kts it is three times stronger than 10 kts. In other words, there is a dramatic difference in what we experience in 10 kts vs even just 15 kts.

We know from our own experience that we could be in a wind of 10 or 11 kts that could blow our hat off if it hit at the right angle. And it would be noted, but not a focus point for any news caster's story. But if this wind were much more, we know that it would be a focus of the conversation, which it wasn't. Note too that the wind came not at the moment when the flags were exchanged, but later when they had the hole opened up enough to walk through.

Such visual effects of the wind is not unlike our view of whitecaps. At 10 kts there are some there if we look carefully; at 15 kts they are easier to see; but at 20 kts they are the dominate factor noted when looking at the water. 

______

Here are a few notes about the Chunnel for those who have not been through it. Prices as low as $200, one way, London to Paris, just 2h 17 min.  (Too bad that the UK bailed on the EU!)


Pressure remains a concern in all such tunnel travel due to the piston effect that can create high pressures in front of the train stressing gear and making travelers uncomfortable. The Chunnel has build in pressure escape valves all along the tunnel to prevent this.


Landmark Labels on ENC

$
0
0

We are one of the first in line to lament the poor coverage of terrestrial charting in electronic navigational charts (ENC) compared to the paper chart coverage we are used to.  And for good reason: we do most piloting relative to landmarks and much of the land mass on ENC is conspicuously blank—which can appear even more moonscape vacant depending how we have the display set up, as shown below.


Unlike viewing raster navigational charts (electronic copies of the paper charts), ENC let the user control many aspects of the display. Above we see an example of choosing to show "Important text only," which is a (misleading) official ENC display option.

If we compare that to what we see on the equivalent paper chart, we see what we are missing in that view.

It is not just the names that can be hidden, but NOAA ENC have very few elevation contours which can often help with piloting. 

Another reason we care about charted place names is a matter of basic safety and prudent seamanship. We teach that it is good policy to always keep in mind a verbal description of where you are, and maybe even note it in the log book that way, ie "Just passing west of Willow Island." Knowing this at all times we are prepared to describe our position over the radio in an emergency—which is much faster than finding, if you can, a read out of the Lat and Lon and reading that with its potential error.  Furthermore it makes the cruise more enduring if you learn these names as you go by.  The say-it-out-loud method is is also how we teach students to learn the stars in cel nav.

Thus these charted place names are valuable to navigation. But things are not so bad as they might appear.  They can be bad, as shown above, but they do not have to be. Below we turn on the text labels to see what we really do have in ENC.

The charted place names are actually all there on the ENC, they are just not as prominent as they are in the paper charts, which have the freedom to use large font sizes for some, and indeed print on a curve.

ENC have strict international rules of font size and orientation, although in some cases they do let labels (and associated symbols) move on the chart so that critical ones remain in view as you change the screen.  A folded paper chart on the chart table may be just hiding a note that a dashed line is marking a restricted Navy firing zone. On the equivalent ENC if you panned that notice off the screen it would suddenly reappear in a new position in view. 

In other words, the use of labels on an ENC is just one more aspect of the new chart reading skills we need to develop for ENC. We have to look at the charts in a new way. One thing that helps with this is the rule that  ENC chart symbols and labels stay the same size regardless of the display scale (zoom level). Thus crucial matters may become more apparent as we zoom into the region of interest.

The Future of ENC

As for other deficits of the terrestrial coverage of existing NOAA ENC, we can be confident that this will improve. First of all, a few nations do a better job with the elevation contours already, and the US certainly has extensive GIS data for all aspects of US mapping. 

To show that big agencies like NOAA should be able to solve this problem fairly soon, we can show how to do this ourselves already.  Beyond its outstanding ENC display presentation, the popular navigation and weather app qtVlm also offers the option to overlay on the chart GIS data as shape files  (.shp), a standard format for GIS data. 

In the sample below, I followed the instructions we have online  to add the roads to Lopez Island and water bodies and elevation contours to Blakely Island, and then (within qtVlm) limit the contours to the 100 ft intervals shown on the paper chart.


Once these are installed, we can get a tool tip presentation of the road names, heights of elevation contours, and related data for water bodies. In fact we learn there are more lakes on Blakely Island than the paper chart showed.

In other words, there is good reason to expect that the terrestrial coverage of future ENC will be even more valuable than that of the paper charts they are replacing. 

We are likely to see this take place first in the printed versions of the ENC called
NOAA Custom Chart (NCC). These are intended to be the (non-official) paper backups of the official ENC viewed on a computer screen or chart plotter.  NCC are user-created online from the NOAA NCC app that produces a PDF chart of the desired region, scale, and paper size, based on the ENC content for that region.  Then it is up to the user to get the chart printed at the chosen paper size.

It is during this NCC production that NOAA could offer the GIS overlay options such as elevation contours, roads, building, water bodies, etc to be added to the PDF they are creating... essentially just as qtVlm offers users the option as shown above. Thus we could end up with a new-generation of paper charts that are indeed superior to what we are now accustomed to.

Seeing this new data in the actual ENC themselves is likely further down the line. Even though a few other nations already have better contours, roads, and buildings, NOAA is likely pretty tied up with their massive process of rescheming all the ENC, which is a major ongoing improvement to the watery parts of the ENC. Not to mention that all nations are in the long process of preparing for the next generation of ENC, where the present IHO S-57 standard will be replaced by the new S-100 standard, which inherently includes a lot of new GIS content. These proposed changes are discussed in our text Introduction to Electronic Chart Navigation.


Nautical Chart Carriage Requirements When Traditional Paper Charts No Longer Exist

$
0
0

Traditional paper charts will all be gone in six months; most are gone now. Here is a summary of  the USCG's official chart carriage policy, followed by a short background, some details, and direct links to the references.

(1) A non-ECDIS vessel that is required to carry nautical charts may meet that requirement with NOAA Custom Charts (NCC), providing they are up to date (within 6 months) and made at adequate size and scale needed for safe navigation in the waters covered, and preferably on adequate paper quality for routine navigation plotting underway. 

 (2) A non-ECDIS vessel on inland waters that is required to carry nautical charts may meet that requirement in lieu of any paper charts on board with an ECS of their choice, providing they are viewing official NOAA ENC, using an adequate size screen for safe navigation (large tablet or computer), and the ENC are up to date.   

(3) Vessels in coastal waters, when relying on electronic charting alone, must display official ENC on an ECS that meets more stringent environmental standards that are outlined in NVIC_01-16 (ch 2)—and under further development at the moment. The ECS manufacturer must provide a declaration of conformity. In the meantime, appropriate NCC can be used in coastal waters. 


Sample section of a NOAA custom chart (NCC)

______________________

Five years ago, NOAA announced to the world that they had begun the process of discontinuing all traditional paper charts and related chart products such as raster navigational charts (RNC), PDF charts, etc. They said it will be a gradual process, but all traditional paper charts will be gone by the end of 2024. 

And they have kept their word on this; at the moment, five months from the promised completion date at the end of this year, we have only 195 charts left of the 1100 or so that existed five years ago, and all of those left are marked last edition (LE). They have not been updated for months, and will not ever be. Even these last charts are already historic items. (The last edition of each NOAA chart once discontinued is available at historicalcharts.noaa.gov.)

Traditional paper charts, with their fixed sizes, scales, and coverage areas, are being replaced with new versions of electronic navigational charts (ENC), downloaded at no charge from NOAA. They are updated daily at 0500 UTC. If we want to know what is changed on the LE charts left, we need to check the corresponding ENC.

NOAA is also offering now a new form of printed chart called a NOAA custom chart (NCC) that is based upon the latest ENC data. These NCC play a key role in our chart navigation going forward,  as discussed below.

In short, this historic and impactful revolution in charting is indeed taking place. All maritime nations have similar plans, in various stages of execution, but the US will lead the way, as it has historically with other aspects of electronic charting. The UKHO, for example, had announced a similar deadline for their transition to all ENC, but has since postponed the date, perhaps in part because they had not worked out the carriage requirements that is the topic at hand for US vessels.

ENC are not a new concept, even though the new reschemed versions are significant improvements over the legacy versions.  ENC have been in use since the mid 1990s.  Since 2018, ENC have been required on nearly all commercial vessels on international voyages. These international ships, and other classes of ships in US waters are required to display the ENC using a type-approved hardware and software system called ECDIS (electronic chart display and information system). But these classes of large "ECDIS vessels" are not a subject at hand, because their rules on charts are not affected by the demise of traditional paper charts.

The International Hydrographic Organization (IHO) specifies the standards for the content and format of ENC in a document called IHO S-57. The IHO also specifies how ENC should appear on the navigator’s chart screen in IHO S-52. An ENC of any nation by definition meets the requirements of  S-57, and ECDIS chart display from any manufacturer by definition meets the requirements of S-52.

In Jan, 2016, the USCG announced (NVIC_01-16) that all commercial vessels not required to use ECDIS, may use ENC in lieu of paper charts, and spelled out the details required. Chart display systems (nav apps and chart plotters) that do not meet ECDIS standards are called electronic charting systems (ECS)—which is not a generic name, it is an official IHO definition. 

This  document was then notably updated in May, 2020 (NVIC_01-16_ch2) and added clarification of the use of electronic versions of other required publications such as the Navigation Rules Handbook, Coast Pilots, Light Lists, and tide and current data—recall that in 2020 NOAA discontinued the authorized publication of annual tide and current tables that use secondary station corrections (Tables 2), and since then it is up to mariners to create their own appropriate tables for required stations using the convenient options at tidesandcurrents.noaa.gov. Tables 2 corrections still in print today are not authorized nor dependable.

Then in June, 2023 an historic internal USCG Policy Letter (NAVPOLTR_01-23) explained the crucial role of NCC. 

Those two documents spell out the rules on chart carriage and display that govern chart carriage after the end of this year when all traditional paper charts will be gone—and they govern the policy right now for areas where there are no paper charts left of an appropriate scale for safe navigation. 

Please read the full documents linked below. My notes here are only brief paraphrases. 


Chart Carriage Requirements During NOAA Chart Sunsetting Plan,

CG-NAV Policy Letter 01-23

(NAVPOLTR_01-23

Key takeaways include...

• Though not stated elsewhere to my knowledge, this document confirms that NOAA custom charts NCC will be accepted as meeting chart carriage requirements, provided:

(1) They are up to date (within 6 months)

(2) Made at an adequate scale and paper size for safe navigation in the waters at hand

(3) Preferably printed on adequate paper quality for routine navigation plotting underway

 • The preference (3) suggests using one of the existing print on demand (POD) chart printers. Several are set up to accept a mariners homemade NCC, and some are offering predesigned NCC options that replicate as near as possible the traditional chart coverages. They are accustomed to chart printing on quality paper.

• The Policy Letter does not rule out individual printing of chart booklets on smaller size paper similar to those used in commercial chart booklets. The economic 34" x 22" option (ANSI D) might meet single chart or booklet applications for smaller commercial vessels.

• The Policy Letter anticipated an important advance in the NCC program that has since been implemented. Namely, in NCC ver 2.0, mariners can save their NCC designs and then return to them and with two button clicks create an updated version of their saved NCC design. We anticipate NCC app ver 3 in mid July.

• Also noted in the Policy Letter is the fact that NCC do not have chart numbers so there are no Local Notices to Mariners presenting proposed or actual changes for specific NCC, but mariners can check on line for latest ENC updates to the regions they have charted and that way decide if a new NCC is needed or not from their saved NCC design.

• We have a portal of NCC related links at starpath.com/NCC.

• It should be noted that the Policy Letter has an expiration date of April, 2025. So until something shows up in the CFRs we should be be aware that things could change at that time.

• References: CG-NAV Policy Letter 01-23,  8b (1) and (2)


Use of Electronic Charts and Publications in Lieu of Paper Charts, 

Maps and Publications, 

Navigation and Vessel Inspection Circular number 01-16, 16700.4  

(NVIC_01-16_ch2

Again, please read the full document; it includes an interesting history of paper and electronic charting. My notes are just brief paraphrases, with these short takeaways...

• The rules for electronic charts only (no paper charts on board) are different for inland vs coastal waters, where "coastal waters" in this context means anywhere on the outer coast, seaward of the MLW line.

• On inland and coastal waters, however, the key factor is we must use official NOAA ENC that are up to date and of adequate scale for the navigation at hand. (This is not a major concern, because most suitable ECS (nav apps), and there are many as noted in the NVIC, offer the option to check for latest updates and load all scales available with a couple button clicks.)

• We stress that third-party charts or charts described as "based on ENC", "modified ENC,""Enhanced ENC," etc, do not qualify. For non-ECDIS vessels to rely on electronic charts only, they must use official NOAA ENC, presumably obtained directly from NOAA, who provides them at no charge, updated daily at 0500 UTC when changes are confirmed. Light List changes take about a week or so to enter into the affected ENC updates.

• A non-ECDIS vessel on inland waters that is required to carry nautical charts may meet that requirement in lieu of any paper charts on board with an ECS of their choice, providing they are viewing up to date NOAA ENC, using an adequate size screen for safe navigation. This is not spelled out more specifically here, but we can note that the  IMO Performance Standards for ECDIS, Sec 10.2, calls for a minimum screen size of 270 mm x 270 mm (10.6" x 10.6"), which is about the size of a nominal 13" laptop or an iPad Pro—keeping in mind that ECDIS standards are not required for inland ECS usage. 

• Non-ECDIS vessels traveling in coastal waters when relying on electronic charting alone, must display official ENC on an ECS that meets more stringent environmental standards that are outlined in NVIC_01-16 (ch 2)—and under further development at the moment. The ECS manufacturer must provide a declaration of conformity. In the meantime, appropriate NCC can be used in coastal waters.

• References:  NVIC_01-16 (ch 2), Enclosure 1, Sec B1, A2, B2. Enclosure 2, Sec B7c.

• This NVIC also clarifies that digital copies (PDFs, for example) of tide and current data, Coast Pilots, Light Lists, and Navigation Rules Handbook can also meet similar carriage requirements—which is a reminder to all vessels, even those not formally required to carry such documents, that they can meet prudent safe-navigation document needs with digital products. 

The active government agencies, USCG, NGA, and several divisions of NOAA, make it very easy to download the documents and keep them up to date. Storing them in the library of your favorite ebook reader is one way to organize them, with convenient search, bookmark, and highlight tools. Ship and instrument manuals can be in another library folder.


Sample ENC section of the same region shown above as NCC, viewed in qtVlm. This ENC has  a compilation scale of 1:12,000. It can be zoomed to show detail.


Zoomed section of the above. Many ECS offer the option to highlight sector light coverage; in this case we see the green light marking the top of the main San Diego Bay entrance range


Summary

These basic rules for the smaller commercial vessels that do not require ECDIS seem very reasonable and practicable. The ECS "of our choice" to view the ENC could be any of the many commercial and even free versions available now, such as Coastal Explorer, TimeZero, Expedition, OpenCPN and qtVlm.  All show official ENC with convenient means of chart downloading and semi-automatic chart updating. They run on computers and some on large tablets, and all include the range of functionality wanted in a versatile ECS.  There are certainly numerous others we have not tested. 

The NCC program for the paper chart alternative is very attractive and slowly becoming better known. There is certainly room to improve, especially with regard to terrain coverage,  but this is understood and on the table to be improved. Indeed, with all the GIS information available these days on elevation contours, roads, building, ground cover, and so on, we can expect NCC of the future to be superior in this regard to the limited but valuable examples on the paper charts being discontinued.

Recreational mariners are not directly affected by chart carriage requirements of commercial vessels, but it is fair that they look up to their rules as guidelines to prudent navigation. And all mariners are, of course, bound by Rule 2a ("good seamanship rule") of the Navigation Rules.


Sailing and Navigation Schools

On the water training of students who paid for the training are required to have a USCG licensed instructor and the vessels are required to have authorized nautical charts on board. Between now and the end of the year, if there is still a traditional NOAA chart available of adequate scale for safe navigation then a copy of that chart will meet this need until Jan 1, 2025. After that, the training vessel must have either an NCC made as noted above, or have a tablet or computer showing official NOAA ENC of the area as explained above. Third party charts do not meet the requirement, and viewing on a small screen (ie phone) alone will not meet the need according to the documents presented.  

On the water training in certain restricted waters that do not require a licensed operator do not have these chart requirements, but simple prudence would  call for them in any event.  As noted, Rule 2a still applies to all navigable waters, as do perhaps local and state rules.

It seems logical that all navigation training should begin the transition to NCC in place of the historic training charts, which have frankly been distractingly outdated for many years. We are now working on NCC replacements for 1210tr and 18465tr. The challenge is creating NCC that have adequate labels so the many standard exercise books and tests in use nationwide for decades can be adapted to the new NCC. We also have a unique challenge of how to cover a significant section of 18465tr that is now only covered by a Canadian ENC.

Even though the historic training charts will remain available, it seems a disservice to students to continue to use them. NOAA has helped with this transition in that they use on the NCC the traditional chart symbols for all ATONS, rather than the official ENC symbols. Presumably that will change in a year or two... or at least we will have the option to show old symbols or official ENC symbols.

_____________

Our text and reference books on ENC usage can be seen at   starpath.com/ENC


Wake Low Winds: When you thought the worst was over!

$
0
0

By David Wilkinson
Starpath Instructor

Strong winds come from a variety of weather patterns. Some are large like a mid-latitude Low, some mid-size like a tropical wave, and some quite small like those found in narrow gaps between islands. Some winds are transient like a downdraft from a passing thunderstorm while others are more persistent like the strong summer winds along the southern Oregon and northern California coast.  

Strong winds from larger, longer lasting weather systems are generally quantified by weather models and included in the official forecasts. But smaller scale, shorter duration winds can fall below the resolution, temporal and spatial, of weather models and can better described by how likely they are to occur in generalized areas. Winds driven by Wake Lows fit into this latter category.

A Wake Low is defined by the American Meteorological Organization as:

a surface low pressure area or mesolow (or the envelope of several low pressure areas) to the rear of a squall line; most commonly found in squall lines with trailing stratiform precipitation regions, in which case the axis of the low is positioned near the back edge of the stratiform rain area.

Because squall lines are bands of thunderstorm, (a.k.a squalls when over water) typically ahead of cold fronts, it is useful to look at the structure of a single squall.  

The squall has a life cycle that starts with a growing phase. Surface winds flow generally inward at the base. These we watch to see if they may eventually become the towering cumulonimbus. If they grow to full maturity, there is a second phase that has a  downdraft creating strong wind that comes with heavy rain, perhaps even hail.

Wind patterns with the two phases of the squall are shown in Figure 1. Notice the strong winds from the downdraft are in front of the squall while behind it the wind can be light or flukey. The difference in the winds fore and aft of the squall is because the direction and speed of the movement adds to or subtracts from the squall wind.

Figure 1 (from Modern Marine Weather by David Burch)


In Figure 2 typically the squall movement would be from left to right. In the mid-latitudes that would be roughly west to east or in the trade winds from east to west. Because squall are embedded in and move with the upper level winds, it is best to review the 500 mb maps or model data or even local soundings to get a sense of squall movement.

Figure 2


Figure 3 shows the atmospheric pressure distribution along the cross-section shown in Figure 2. The Mesohigh is found under the core area of Figure 2 and the Wake Low is in the area under the stratiform clouds.

Figure 3


As the squall moves from left to right, the leading low pressure area experiences strong winds blowing from the Mesohigh and toward the low. This is the source of the common wind gusts experienced on the leading edge of a squall. 

On the aft side of the squall, the wind is again driven by the Mesohigh toward low pressure. Because this area of low pressure is on the aft side of the low or in its “wake”, the term Wake Low seems to fit.  One key takeaway is that the wind direction will reverse or at least make a very large veer due to the reversal of the pressure gradient as the squall passes. How quickly the wind direction changes would be affected by the strength of the pressure gradient and speed of the squall.

Wind speeds can be estimated using the pressure gradients and scaling provided in Figure 3.  With some unit conversions, the pressure gradient in millibars/degrees latitude would be about 4 mb/0.6*. From Figure 4, assuming 45* latitude, this gradient estimates a wind speed of 76 kt! Although this is just a graphic for demonstration purposes, the magnitude of the wind speed is worth noting.

Figure 4


Figure 5 is from a case study of a Wake Low that occurred on September 2, 2010. The National Weather Service analyzed the pressure drop over a 2 hour period (blue dashed contours) of up to -3 mb. The Duluth International Airport actually observed a 6.1 mb pressure drop in only 28 minutes resulting in a wind speed of 50 kt. 

Figure 5


Because Wake Lows are a relatively small scale, short duration event, they are difficult to forecast in terms of wind direction and speed at a specific time and location. However, squall or thunderstorm potential is routinely forecast by the NOAA Storm Prediction Center in its Mesoscale Discussions and Convective Outlooks for CONUS and coastal waters, Figure 6.

Figure 6


While the case studies tend to be in the upper mid-west area of CONUS, they do not suggest that Wake Lows would be limited to those areas.  It may just be that only over land is there enough observational data to support the analysis of this relatively small-scale, transient event. This leaves mariners to ask whether winds resulting from Wake Lows could happen more generally anywhere squalls are found.  After all, strong winds that radically change direction are something to look out for!

Summary

·      Wake Lows are atmospheric low pressure areas found on the aft side of squall lines

·      Fluctuating pressure gradients caused by Wake Lows can cause dramatic changes in wind direction

·      Strong winds are a potential both on the leading and trailing sides of squall lines

·      Wake Lows are small scale, transient events that may be anticipated where squall lines are forecast 

·      For safety, anticipate strong and gusty winds, as well as heavy rain and lightning with cumulonimbus clouds

References:                                                                                                                                      

·      American Meteorological Society Glossary

·      Modern Marine Weather, 3rd ed.

·      Storm Prediction Center

·      https://www.weather.gov/meg/wakelowres

·      https://www.weather.gov/fsd/20180511_wakelow_SDNEIA

·      https://www.weather.gov/dlh/100902_wakelow


How to Get a Copy of a Discontinued NOAA Chart

$
0
0
Part 1. I know the name or number of the discontinued chart I want. 

(a) Go to Part 3.


Part 2. I do not know what charts were available that no longer exist.

(a) First we need to find out what charts existed. There is a list of all charts at NOAA but we cannot tell from that what they covered, so we use a trick to learn the names of charts and what they covered.  Download this file Historic_NOAA_charts.kml that we will then load into Google Earth (GE), which will show all the historic chart outlines.


Above is what you see after dragging the KML file onto GE, or maybe just double clicking the file might open GE and load the KML file.  Then you can zoom into see the charts.


(b) Mouse over a chart outline to highlight it then left click to get the info. This is an example of a discontinued chart, 18433 Haro Strait Middle Bank to Stuart Island. We once had a full set of these spanning the San Juan Islands at 1:25,000 but they are all gone. For now there is just one 1:80,000 for the whole region—but we should get new reschemed 1:22,000 set of ENC sometime early next year.

(Note that if the chart still exists, you can click one of the preview options and see it, but it is easier by other methods to do that....see starpath.com/getcharts.)

For this example, we assume this is the only one we want, ie we want a copy of the Last Edition of this chart, which was discontinued about two years ago—so the one we get is going to be out dated.

(c) Now that we know the chart we want, we can go to Part 3.


Part 3. Get a copy of a chart whose name or number I know

(a) Go this NOAA link historicalcharts.noaa.gov.

(b) On the first page, click the link to Hide the map search.


(c) Then enter the chart number... space is too small but it will take it!  Then press Search.


(d)  Now we see the chart we want, Last Edition of 18433. We can download a JPG of PDF of the image. These PDFs are not georeferenced, like the NCC PDFs are. So if we want to load this chart into a nav program, we might as well use the JPG, which we can manually georeference in several nav programs.  

We can also take a look at the chart with the Preview link. Again, we are looking at an historic item. We could have several reasons to want this, but we must remember it is outdated.


Same image zoomed in to show it is a high-res image.


Part 4. How to load a historic chart (georeferenced) into a navigation program

(a) To be added. It takes just a few steps and a minute or two!

Learning Chart Navigation Using NOAA Custom Charts (NCC)

$
0
0

We are in the midst of a revolution in US nautical charting. Traditional paper charts (TPC) have been discontinued by NOAA — a process that started five years ago and is essentially completed now, Fall, 2024. There are a few TPC that can still be purchased from the NOAA print on demand (POD) outlets, but these are all marked "Last Edition" and none have been updated for many months, and never will be.

In short, there are no more TPC for marine navigation, but this is not such a shocking state of affairs as it might appear. There is a new style of paper chart that is intended to replace the TPC called NOAA Custom Charts (NCC) and going forward we will use these for our traditional chart plotting just as we did with the discontinued TPC. 

These new charts have in fact notable advantages over the TPC: one being we can make our own NCC using a NOAA online app that lets us choose the area we want to cover — we are no longer bound to the old, fixed regions of the TPC.  

We can also choose the chart scale we want and the paper size we want. The products we create are high-resolution precisely-scaled PDFs that we can print as we see best. We have an article on NCC printing options for the several standard NCC sizes. Quite a bit of money can be saved if we do not need the largest sizes printed on high-quality chart paper.  If we do want big charts on traditional chart paper, then we can have our own creations printed at one of the POD outlets by sending them your PDF, or you can without doing anything online, just contact them and ask for an NCC version of your favorite TPC.

The new version you will get for a favorite TPC will be essentially identical with regard to the charing in the water, even using the same ATON symbols you are used to. The land areas will have less detail for the time being, but this will improve in the coming months. In the end, the land areas of the charts could well have much more useful detail than the TPC they are replacing.

The NCC are based on the latest electronic navigational charts (ENC), which are updated daily at about 0500 UTC. 

The most important fact about these new charts is this: the way we plot our courses and solve for piloting fixes on a paper chart is exactly the same on NCC as it was with TPC. We will just be using chart sizes and areas of our choosing, rather than the fixed TPC options we had in the past. Now we can have a chart of our own Bay on 11x17 paper that we print at home or at the local Office Depot, or an overview that spans three of the past TPC.

Navigation schools also have much more freedom to set up practice exercises in various parts of the country since chartlets can be printed on letter paper. Note that when making your NCC, you have the option to add compass roses where yu want. So this, too, is an advantage as you can place these where ever you think best.

One handicap that they should overcome shortly is the absence of the Mean High Water (MHW) value for the chart. We need this to predict the range of lights and hilltops as well as to compute bridge clearances. Thus we must learn to look this up at www.tidesandcurrents.noaa.gov and then write it on the chart somewhere. Strangely, this important number is not so easy to find at NOAA, the video below shows how to find it from the ENC in the background of the NCC app.  MHW was always on every TPC, but they have yet to figure how to add it to NCC.

We have several related resources you can use to get involved with the new charts. Here are a couple:


How to make a simple NOAA Custom Chart


The State of NOAA charts last half of 2024


Resources on NCC including links to NCC app and videos on its usage.

NCC printing options

NCC POD Outlets


How do get a copy of a discontinued NOAA TPC


TPC are being replaced by ENC. Here is our portal to all issues related to ENC

www.starpath.com/getcharts


In our online navigation courses we now include exercises using NCC.


Wreck Symbols on Electronic Navigational Charts (ENC)

$
0
0

The International Hydrographic Organization (IHO) describes light symbols as the most complex electronic navigational chart (ENC) symbols in their own published standard for the symbols called IHO Pub S-52, Annex A, Presentation Library. Anyone can download Pub S-52, but the Presentation Library costs 500 euros! Pirated or draft copies sometimes found online are typically wrong, and can lead to hours of wasted time with no productive results—I did not make that up!

But the IHO does not give themselves all the credit they deserve, regarding difficult symbols. Let's take a look at the rules for wreck symbols on ENC, for example.

It all starts out with the few symbols presented  below with the official IHO explanations, followed by our notes on the required attributes, which are explained in more detail later in the post. 

This is also an exercise in working with ENC objects and attributes, which will become more familiar to mariners as we learn to live without traditional paper charts, relying on the ENC as the only official nautical charts.

____________________


Symbol Name: SY(WRECKS01) 

IHO Symbol Explanation: wreck showing any portion of hull or superstructure at level of chart datum. 

Attributes: VALSOU not given;  CATWRK = 4 or 5  or WATLEV = 1, 2, 4, or 5.  This symbol means there is no sounding given for the wreck and some part of it is showing at all stages of the tide.

The IHO reference to "chart datum" means "sounding datum," which is always zero tide height on all ENC from any nation. 

____________________

Symbol Name: SY(WRECKS04)

IHO Symbol Explanation: non-dangerous wreck, depth unknown.

Attributes: VALSOU not given; CATWRK = 1;  and WATLEV = 3. In other words, no sounding given, it is charted as not dangerous, and it is always underwater.

____________________


Symbol Name: SY(WRECKS05)

IHO Symbol Explanation: dangerous wreck, depth unknown.

Attributes: VALSOU not given; CATWRK = 2;  and WATLEV = 3. In other words, no sounding given, charted as dangerous, and always underwater. 

____________________

Wrecks can also be plotted as a generic hazard (meaning rock, wreck, or obstruction) with one of these symbols when the value of sounding (VALSOU) of the wreck is known.

____________________

Symbol Name: SY(DANGER01)

IHO Symbol Explanation: underwater hazard with a defined depth.

Attributes: VALSOU less than or equal to the mariner's choice of Safety Depth. 

____________________

Symbol Name: SY(DANGER02)

IHO Symbol Explanation: underwater hazard with depth greater than 20 metres.

Attributes VALSOU greater than the mariner's choice of Safety Depth. 

Note that the official IHO Symbol Explanation given above, taken from the latest edition Presentation Library, is not correct. There is a detailed Conditional Symbology Procedure (CSP) explaining when to use this symbol, and it is based on the Safety Depth, not on a fixed 20 meters depth. Both the US and the UK Chart No. 1 booklets include the incorrect reference to 20 meters. Consequently, some navigation apps (ECS) also do not make this depth distinction correctly, so the symbols in those apps do not change from blue to clear at the correct sounding. It is not a major effect navigationally, but reflects the complexity of the symbol.

____________________

Wrecks can also be plotted as an isolated danger, depending on its location relative to the navigator's choice of requested safety contour.

____________________

Symbol Name: SY(ISODGR01)

IHO Symbol Explanation: isolated danger of depth less than the safety contour.

Attributes: This means that if the wreck is outside of the displayed safety contour and it has a sounding less than the requested safety contour, then the wreck symbol is replaced with the isolated danger symbol—depending on several other properties of the wreck.  That procedure applies to all hazards (rocks, wrecks, and obstructions). 

Most ENC users are familiar with that general behavior of the isolated danger symbol, but not so many realize that the reference sounding is the requested safety contour, not the displayed safety contour, and this is not at all clear in the IHO Symbol Explanation.

We have in practice two safety contours. We have the one we requested, say 8 m, and we have the one displayed on the screen, which might be 10 m, because only contours native to the ENC can be assigned as the displayed safety contour. This special contour is then made bold and it separates two prominent water colors, and also triggers various alarms when crossed. If our requested contour is not in the ENC, the next deepest contour is selected for display.

For example, we request a safety contour of 8 m, but there is none in the ENC, so the active safety contour displayed is at 10 m.  On the deep side of the 10 m safety contour there is a wreck with a sounding of 7 m.  This is shallower than our requested 8 m and outside the displayed safety contour at 10 m, so this one will be replaced by an isolated danger symbol.

If we then change our requested safety contour to 6 m, the displayed safety contour will stay at 10m, but now our wreck is deeper than our requested safety contour, so it will not be replaced with an isolated danger symbol.

____________________

Those are all of the possible symbols for a wreck. Any wreck on the chart will be one of those symbols. The tricky part is how does a specific nav app (electronic charting system, ECS), decide which symbol to show? This is not such an easy question. The rules are spelled out in the S-52 Presentation Library, which in turn depend on the specific attributes of the object WRECK. These attributes are encoded into the ENC using rules from another IHO standard called S-57.

The attributes of the object WRECK that determine how it should be plotted are:

WATLEV, water level effect 

        VALSOU, value of sounding  

CATWRK, category of wreck

EXPSOU, exposition of sounding

Every WRECK must have a WATLEV, plus it must have either a VALSOU or a CATWRK. You can review these attributes at caris.com/s-57.


WATLEV describes the visibility of the wreck as the tide changes.   The options are:

ID    Meaning

1partly submerged at high water  

2always dry

3always under water/submerged

4covers and uncovers

5awash

6subject to inundation or flooding   

7floating

A wreck with WATLEV = 3, always submerged, with no sounding given, will have one of the traditional wreck symbols we are used to from  traditional paper charts, WRECKS04 or WRECKS05.


VALSOU is a single number, the depth of the water over the wreck when the tide is 0.  This can be a positive number, such as 3.5 m, meaning when the tide is 0, the top of the wreck is 3.5 m below the surface, or it could be -3.5 m, meaning when the tide is 0, the top of the wreck is 3.5 m above the water. Negative soundings are drying heights. Depending on the range of the tide and the location of the object, it could be underwater at all tide levels, or it could cover and uncover with the tide, or it could be always visible to some extent regardless of tide height. A drying height sounding is shown underlined on the screen. We see wrecks that cover and uncover with known drying heights along or in the foreshore.

A known VALSOU means the wreck will be shown as one of the the three danger symbols shown above, and not the type of wreck symbol we were accustomed to on traditional paper charts.

The VALSOU relative to the mariner's choice of Safety Depth determines the symbol DANGER01 vs DANGER02, regardless of other attributes.

CATWRK can have a direct influence on the symbol used. The options are:

 IDMeaning

1non-dangerous wreck

2dangerous wreck

3distributed remains of wreck

4wreck showing mast/masts

5wreck showing any portion of hull or superstructure

Each nation making ENC have to establish how they are going to define a wreck as dangerous or not.  It is not spelled out in the IHO S-57.  NOAA's own Chart Manual, Vol 3, Section 6.3.2 on ENC production states that all NOAA ENC will encode any wreck as dangerous if it is known to be shallower than 20.1 m. They do not need to know its actual sounding, only this limit.


EXPSOU has a more subtle effect on the symbol. The options are:

IDMeaning

1within the range of depth of the surrounding depth area

2shoaler than the range of depth of the surrounding depth area

3deeper than the range of depth of the surrounding depth area

This attribute only affects whether or not a wreck symbol (or any hazard) will show up as an isolated danger symbol. In some rare cases where all of the above discussed criteria are met, it still will not show as an isolated danger symbol based on a set of very complex rules related to the shape of the seabed near the object. The value of EXPSOU is key to this decision, but it does not otherwise affect wreck symbols.

____________________

This last detail (special cases of hazards not showing up as danger symbols when we might expect them to) is not so crucial in practical use of ENC because the first thing we learn is we must cursor pick any object that might be crucial and the pick report will tell us all about the object and its attributes. Furthermore, isolated danger symbols are an all new concept in ENC that we are not familiar with on paper charts, so it would be rare to even know something is unique about any specific example.

Also we note the commonality of all hazard symbols on ENC. For most encounters it does not matter at all if we are avoiding a rock, wreck, or obstruction, and indeed more often than not they have the same symbols.


USCG License Exams Come of Age — Tide Wise

$
0
0

 In 2020 NOAA announced that this was the last year they were going to authorize an annual set of tables for tides or for currents. The tables were called:

Tide Tables

2020 East Coast of North and South America Including Greenland

2020 Europe and West Coast of Africa Including the Mediterranean Sea

2020 Central and Western Pacific Ocean and Indian Ocean

2020 West Coast of North and South America Including the Hawaiian Islands

Tidal Current Tables

2020 Atlantic Coast of North America

2020 Pacific Coast of North America and Asia.

Prior to 2021, these were "the official sources." All other third-party printed or electronic  presentations of  US tide and current data, readily found along the waterways and cybersphere, were derived from these, sometimes mixing up actual locations or confusing standard times and daylight times. 

These are what we called "The Tide Tables" or "The Current Tables" that were either required or recommended to be on all vessels. These tables included daily data for numerous Reference Stations and then a Table 2 that included corrections to be applied to thousands of Secondary Stations.

That ended in 2021. And despite the fact that some third party companies still print these tables including the Table 2 data that they reproduce from the 2020 tables, the data are not valid. Hundreds of those secondary stations have been discontinued and values for many others have changed.

But more to the point at hand, up till just recently, the USCG license exams still covered the Table 2 procedures using the old Table 2 data, which has been totally wrong for nearly 5 years now, as many schools around the country still do now as well.

The USCG has now corrected that and their new exams treat tides and currents in the modern, correct manner, which is outlined below.  This greatly simplifies this important part of navigation.  We wrote several notes on this in the past:

No More Tide and Currents Table 2 — Navigation Students Celebrate!  

and

NOAA Discontinues Tide and Current Books — What Do We Do Now?

You can review these for background and in the second one for step by step procedures for most efficient access to the new data, including how to make your own set of annual tables

Another aspect of the simplicity (progress) is that tide and current questions are now essentially the same for entry level OUPV license exams as they are for unlimited ocean master.

Here is an example.


The diagrams included are:


The solution to #36 is fast. Go to the time on the graph and read the speed, then note that the harmonic directions are given in the figure titles. 

That is the right answer to the test question, but not at all the guaranteed answer on the water. These currents are treated as pure reversing, with two directions only, but in practice they rotate, flowing with some strength in an ellipse of directions. The direction given is just the average direction around the time of peak flow at the long axis ends of the ellipse.

Question #35 asks about rotary currents, which is interesting in that the discontinued annual current tables did have a Table 5 listing details of rotary currents along the coast. But these data are no longer available at the NOAA site, as such. Nevertheless, we can answer this question by looking up any coastal station along the East Coast and seeing how long it takes between successive floods or ebbs, and it will be about 12 hr.

The tide problem, #37, is just as direct. We are between two stations that have different heights but we are only asked for time, and that is the same for both. If they had ask for height the answer would, presumably,  be (0.51+0.29)/2 = 0.4 ft.


(Tide heights are pretty uniform over large areas of open water, so the tide values are more likely to be correct out on the water than the current values — assuming the atmospheric pressure is about normal, and the wind has not been strong over the past 12h, and there is no unusual river run off, all of which can throw the water level predictions off a foot or two.)

Likewise for the other end of the license exam spectrum, unlimited master.


This the same as #36, but we have to adjust the time. Starting at 0130 we must travel 15 nmi at 10 kt which takes 1.5h so we get there at 0300.

Question #6 for unlimited master is the same as the #37 for OUPV.


______________________

So the summary is the USCG exams now follow the existing procedures for tides and currents, which is tremendously easier and faster than it was before. It is a pity that the invalid Table 2 data (for tides and currents) are still being published by third party printers, but we should just know this, and move on.

Our main resource for all tide and current data is now www.tidesandcurrents.noaa.gov.  Please refer to the article above (What do we do now?) for the exact steps for the most efficient use of the NOAA site. The best procedure is not intuitive. What might seem an intuitive approach can lead to other types of data that you likely do not want. We want the types of data shown in these USCG exam diagrams. In that article there is also a video showing the steps.

The article also shows how to make annual tables for any station. It takes just 4 pages per year, per station. We do not need the historic books that covered all of North America. We need just the stations covering the tidal waters we navigate.

Our book Inland and Coastal Navigationcovers the use of the NOAA website, and our Navigation WorkBook 18465Tr  has practice exercises. In practice a new challenge arises in finding the nearest station you care about (illustrated in the links above), or you can use a program like qtVlm or OpenCPN that used tested harmonic data from NOAA and they show where all the stations are.


Barometers and Marine Navigation

$
0
0

Even in the age of high-speed internet at sea, remarkable weather model forecasts, and satellite wind measurements, our knowledge of the correct atmospheric pressure, and how it changes with time, remains the key to safe, efficient routing decisions. Pressure data are also the most direct means of evaluating the model forecasts that we ultimately rely on for routing.

Productive barometer use in navigation is a relatively new concept—it was actually used more effectively in the 1700s than in the 1900s! The Barometer Handbook explains its interesting history and its role in marine navigation. The major change came when accurate, affordable digital barometers started to find their way on to boats. Now we have many options. Chances are the barometer in your phone is the most accurate barometer on the boat, and the easiest to use with a good app. Several options for mobile devices and computers are listed at starpath.com/marinebarometer, which also includes a link to an extensive set of barometer resources.

Phone barometers are typically accurate to better than ± 2 mb right out of the box, and it is relatively easy to improve on that with online resources given in the link above. The goal would be to get its accuracy down to < 1 mb, which is the effective standard used in the buoy and ship reports shown on surface analysis maps. Map pressures and forecasts give the pressures to a precision of 0.1 mb, so we can make comparisons on that level, keeping in mind the overall uncertainty.

Unlike aneroid barometers, modern sensor accuracies do not vary much (just a few tenths) over the full pressure range we expect at sea—940 mb to 1040 mb, always hoping to avoid the two ends! Thus setting it to the right pressure at any value is effectively calibrating it over the full range. One fast way to calibrate in US coastal waters is to make regular comparisons with NOAA stations accessed through tidesandcurrents.noaa.gov. Procedure: (1) Go to the site and click your state. (2) Turn on Barometric pressure on the right. (3) Zoom in to find two pressures to interpolate between. (4) Consider this to be the correct sea level pressure (SLP) at the moment, compare this to your barometer reading, and record the difference in a logbook. These data are updated every 6 min. 

Remember your pressure will be lower than the sea level value even if your barometer is spot on because you are at some height above sea level. Precise corrections are in the resources cited above, but you can compute the correction with the jingle "Point four four per floor," which means the pressure drops 0.44 mb for each 12 ft above sea level. Correct your reading for your height before comparing the two.

With a calibrated barometer we are ready to tackle some weather applications. Many ocean sailing routes are going around Highs because there is no wind in the middle of the Highs. We may be following a rule of thumb, such as stay two isobars (8 mb) off the central pressure, or we might be following a computed route that often takes us dangerously close to the High. In any event, knowing how the High is moving is crucial information. With a good barometer you can tell if the pressure is rising or falling very quickly, because the instruments can dependably show steady changes of just a few tenths of a mb. 

When interpreting any pressure change, we need to keep several things in mind. The pressure will go up if the High is indeed moving toward us, or if it is not moving, and we are sailing toward it. It can also go up if neither one of us is moving, but the High is just building. So, we need to watch our track on the chart compared to the isobars on the chart from the model forecast we are using to properly interpret changes detected. At lower latitudes, we also must correct for the semidiurnal variation of the pressure caused by a tidal effect in the atmosphere. It is a variation of about ± 1.7 mb, with two highs and two lows daily. Check out a pressure plot from any ndbc.noaa.gov station in the tropics to see the pattern.

A good barometer is especially valuable sailing in waters prone to tropical storms, because the standard deviation of the pressure is very low in these waters—typically 2 mb or so. When sailing there for some time, you will know the mean ambient pressure for that time and place (after correcting for semidiurnal variation), which might be about 1013 mb. Then when you observe the average pressure drop to 1009, you know this is almost certainly the approach of a tropical storm, even if the wind or clouds have not signaled it. A drop of 2 standard deviations has only a 2.3% chance of being a statistical variation of the pressure. This does not work at higher latitudes because the standard deviations are much larger.

As a general guideline to the interpretation of pressure drops at any latitude, we suggest the rule "4-5-6" meaning any change of 4 or 5 mb over a 6 hr period is fair warning that bad weather might be headed your way. Not guaranteed, just a guideline to practice with to see how well it works for you. Drops of much less than that do not usually signify anything, and much more than that often puts you past the realm of forecasting. It is there. With a good barometer we can monitor this guideline precisely.

Beyond those couple examples of pressure as forecaster, a key role of the barometer these days is for evaluating numerical forecasts. Remember, there will always be a model forecast, and they are not marked good or bad. It is up to us to evaluate the forecast in every way we can before setting routes based upon it. We would also do this with the wind speed and wind direction, but both have several corrections to apply, plus they rely on instruments that are difficult to calibrate accurately. With the barometer we can know before we leave the dock that our barometer is spot on, and then we are just comparing two numbers. 

For this evaluation, we need to log the measured pressure at least at every synoptic time (00, 06, 12, 18 UTC). We then look back over our track on the screen to where we were at the synoptic time and compare our pressure to what the forecast says. If the pressures agree within a mb, we have a hopeful sign the forecast could be right, but we learn more if they notably do not agree. Then we know the forecast is wrong on some level. With practice we can likely piece together, including using the wind data, how it might be wrong—i.e., too early, or too late; isobars rotated, Low or High deeper than forecasted, and so on. The barometer gives us one clean, indisputable data point to use.


Six-minute pressure reports from tidesandcurrents.noaa.gov. If you were in Salisbury, MD your correct SLP would be (1018.6 + 1017.4)/2 = 1018.0

Squall Forecasts

$
0
0
It is likely known that we can get GRIB formatted wind and pressure forecasts from numerical weather models such as GFS. But it is probably less known that we can get usable squall forecasts as well. We get this from the output parameter composite reflectivity (REFC), often called “simulated weather radar,” which is effectively what it is. Once we are in an area of squalls, we can indeed watch them and maneuver around or with them using our marine radar, but it is often valuable to know when they are likely, how severe they might be, and how they will move.

It was not that long ago that navigators beat themselves up chasing atmospheric instability parameters such as CAPE (convective available potential energy) and CIN (convective inhibition) and LI (lifted index) hoping to piece together a usable probability of squalls and their severity—with, I venture to guess, much the same success I had, minimal at best. Now we have a new generation of navigators who can skip all of that, and let the models do the stability analysis, and report it to us as a nice weather radar image right on our chart screens. It is in a sense like new navigators now never having to struggle with the Table 2 tide and current secondary-station corrections, which were, thank goodness, discontinued in 2021.

We can see what live weather radar looks like nationwide at radar.weather.gov. Our textbook Modern Marine Weatherhas an extended section on the interpretation of REFC.


Figure 1. Sample weather radar. From Modern Marine Weather.


Figure 2. Unofficial guidelines for relating dBZ to squall intensity. From Modern Marine Weather.

The units of reflectivity (Z) are complex and logarithmic (see noaa.gov/jetstream/reflectivity), so they have been simplified to decibels as dBZ. There is no official scale for squall wind intensity, but we made a rough correlation with thunderstorms (rain based) in Figure 2, which has proven practicable. We thus anticipate severe squalls for dBZ values above 40 or so. Squall conditions are most severe with fastest onset where the dBZ gradient is steep, meaning color change from blue to red is narrow.
Besides the global model GFS, the regional model HRRR also provides REFC. Gribs of both models are available by email request from Saildocs. REFC is also included in the high-res NAM models. A sample is shown in Figure 3.


Figure 3. REFC display from the NAM-Puerto-Rico model downloaded and displayed in LuckGrib (luckgrib. com). Forecasted squall winds of 32 kts, gusting to 36, in an area with REFC about 62 dBZ.

This is just a 4-hr forecast, but the general information would have been known earlier. These data are best in the regional models with higher resolution and more frequent updates. The GFS and NAM are only updated every 6 hr, but the HRRR is updated hourly, so it can be useful for near-live squall forecasting in local waters.

You can test these forecasts by looking at the actual weather radar for the same region and time, as shown in Figure 4.


Figure 4. Sample weather radar at about the same time and place as the NAM forecast in Figure 3.

To practice with this, look at the national radar map to find squalls (Florida has the most) and then compare to an HRRR REFC forecast for the area. The hourly updates of HRRR extend out 18 hr, except those run at the synoptic times (00, 06, 12, 18 UTC) that extend out to 48 hr.

Note in passing that the HRRR forecasts for all parameters might be your best local weather forecast available, especially in remote parts of the country.

The New Revolution in Tide and Current Predictions.

$
0
0
First published on OceanNavigator.com 

We had one tidal revolution in 2021 when NOAA announced that they were discontinuing the decades-long use of Table 2 lists of secondary station corrections, and that there will no longer be any sanctioned annual Tide and Current Tables. Plus there will no longer be any international tidal data published by NOAA. Going forward, the way we get official tide and current predictions is go to tidesandcurrents.noaa.gov and create a monthly or annual table for specific stations as PDFs and then print them. It takes four pages per year, per station. This is a superior system, as we rarely needed the global coverage in the historic annual tables, plus the use of Tables 2 (one for tides and one for currents) was tedious, and, indeed, we learn now, not accurate in many cases. We still see in 2025 the discontinued 2020 Tables 2 in some third-party tide or current books, but it is important to know that much of that content is wrong.

The USCG have also now recognized that historic tidal predictions have not been valid since 2021 and the new round of license exams have removed all Table 2 references in lieu of the modern approach of direct data from tidesandcurrents.noaa.gov.  This is also now updated in all electronic navigational charts (ENC). All previous references to “NOAA Tide and Current Tables” have been removed.

But with that revolution still unknown to many mariners, we have a new one!  NOAA’s new Operational Forecast System (OFS) now produces digital tide and current forecasts that are superior to the traditional NOAA predictions, which are based on harmonic constants for each station. We now have tidal current forecasts uniformly over the full waterways, out two or three days, in fifteen regions and two channels around the country. 


Figure 1.
Regions where there are OFS digital tide and current forecasts. See
tidesandcurrents.noaa.gov/models

The beauty of the OFS model forecasts is they take into account the local values of wind and pressure, as well as unseasonal river runoff. The models are updated four times a day to account for changes in these local environmental factors that affect tide height and current flow. The model data has a latency of  about 2 hours, meaning a 3-day set of hourly forecasts run at 12z will be available to mariners at about 14z.

The other huge improvement are the OFS current directions. Traditional harmonic currents are presented as pure reversing currents with just two directions, being the average flood and average ebb directions. But most open water currents are rotating currents to some extent, which do not have just two directions. An example is in Figure 2.

Figure 2.A comparison of OFS model forecasts at the location of a specific harmonic station on Feb 4, 2025, UTC to the harmonic predictions at that station

Where to get OFS tide and current forecasts.

For the time being, NOAA presents the OFS forecasts as graphic animations such as shown in Figure 3. These animations are not a very precise way to access this very precise data, but they are working on other presentations. In the meantime, third party navigation apps have solved this problem for us, which we come back to shortly.


Figure 3.Sample OFS currents as presented by NOAA. To access these, start at tidesandcurrents.noaa.gov/models and  choose a region on the left. Then scroll to the bottom of the page, and under currents click Forecast Guidance. If that link is not there, then click any subdomain indicated on the main image, and then look for the current link.

NOAA is also working on a new OceansMap web app that promises to be a sophisticated digital display that replaces the Figure 3 animations. A sample from the beta version is shown in Figure 4.


Figure 4.San Francisco OFS currents displayed in the forthcoming NOAA OceansMap web page. When completed, it will also show the harmonic predictions as well as the NDBC buoys that measure currents for direct validation checks. Please keep in mind that this is still a developing beta and all features may not work yet as intended.

In the meantime, we also have presentations from other agencies. A particularly nice one is from the Northwest Association of Networked Ocean Observing Systems (NANOOS) for the Salish Sea region shown in Figure 5.


Figure 5.NANOOS presentation of the Salish Sea OFS data, continuously updated. Click any point on the map to read the set and drift of the current. The value of this data has been confirmed by sailors in Port Townsend Bay. Other members of the
Integrated Ocean Observing System (IOOS) have related presentations of OFS data.

These graphic presentations show us the general flow of the tidal currents, revealing patterns we would never know from the isolated harmonic station predictions alone, but for actual navigation underway we need the digital data in GRIB format. This way we can load it into navigation programs and compute optimum routing for all classes of vessels, but this is specifically crucial to sailors and low-powered craft. The problem is the official data are only published in NetCDF format, which most nav apps cannot read.

But mariners can be grateful to two marine navigation apps who have taken it on their own to convert this crucial data to GRIB format. They are Expedition and LuckGrib. The former is a popular racing and performance PC app, and the latter is a state of the art marine weather data source and display for Mac and iOS. Both can incorporate OFS currents into optimum inland routing computations. Both apps also allow users to export the OFS grib files they created. LuckGrib has a two-week, full-function demo period, so users can experiment with this OFS data and other features it offers.

Figure 6 shows the Salish Sea OFS grib file exported from LuckGrib and then loaded it into qtVlm, another nav app which is chosen here because it can display the OFS forecasts as well as the NOAA harmonic station predictions so we can compare the two current sources. qtVlm is a free app for Mac or PC.


Figure 6.Salish Sea OFS forecasts (black arrows) compared to the harmonic forecasts (colored arrows). In the gray labels, M is the OFS Model forecasts, and T are the Tabulated NOAA harmonic predictions. The yellow labels show the model values we would not know from harmonic predictions alone. We see that at the harmonic station locations (circled) the speeds are usually pretty close, which gives us confidence that the model data are right at other locations. The differences in directions between model and harmonic currents can be larger in between the peak and slack samples shown here. We are reminded in the slack data (bottom picture), that slack water is rarely still water —  the model data makes this even more apparent.

Usually tidal currents affect our navigation more than the tide heights themselves, but there can be exceptions, and the OFS model includes tide heights that can help with this. One example would be predicting current flow along a narrow that has no harmonic predictions nor OFS current forecasts for the channel. Such cases are usually controlled by the tide height at each end, with current flowing from the higher-tide side toward the lower-tide side.  An example is shown in Figure 7.


Figure 7. Salish Sea OFS tide height forecasts (background colors, mostly green) in the region of the Swinomish Channel that flows past La Conner, WA, displayed in qtVlm along with the harmonic predictions (small meters) at several locations.  Local knowledge calls for the current to start flowing north sometime between 2.5 to 4 hours before high water (HW) at La Conner, and last till the same interval past HW — and even this broad prescription is known to be sensitive to the state of local river runoff and the range of the tide. The OFS tides include the effects of present and forecasted winds and river runoff, so it is likely that the OFS tide forecasts can be used for more precise predictions of these currents. In this example, there is a notable slope in tide height across the channel 6 hours before HW.

Predicting Tidal Currents in the Swinomish Channel

$
0
0
Historically there have been no NOAA predictions for the tidal current speed in the Swinomish Channel flowing past La Conner, WA, but local mariners know it can be strong—over 2 kts at times.

Years ago we noted that this current should be predictable from the tide difference at the north and south ends of the channel—a driving force called a hydraulic head. The current flows from the high-tide end toward the low-tide end, and the bigger that difference, the stronger the current.

There is a NOAA tide station at La Conner (#9448558), 1.4 nmi into the 6-nmi long channel from the south and another right at the north end of the channel (#9448682). Typical channel widths are 300 to 400 ft, but navigable waters are narrower—dredged to minimum of 12 ft over 100 ft width. I note that the only chart of the Channel (US5WA31M) apparently has the dredge depth wrong at 6 ft. We have reported this to NOAA.

Historically mariners did not have digital tides on board, so it was tedious to copy the tides from tidesandcurrents.noaa.gov and transfer them to a spread sheet to make the current forecasts. I am not sure that method ever caught on with local mariners; we originally worked on this for a specific Seattle to Bellingham kayak race.

Whether or not that procedure ever became popular does not matter, because we have now an all new way to get presumably good forecasts for the channel current with the click of a button, thanks to the newly available results of the Operational Forecast System (OFS) model along with also new developments in how to read that data.

The driving force of the current and the way to forecast it remains true, but we have much better data now on the actual tide heights. The Salish Sea and Columbia River OFS model (SSCOFS) forecasts the current in the channel every hour out 3 days, and the model is recomputed every 6 hr to take into account changes in local environmental factors that can have major effects on tides and currents. The big advantage of the model forecasts is they take into account local values of wind, pressure, and river runoff, which the static harmonic NOAA station predictions do not account for.  

For the moment, we can see these new current forecasts online two ways. One is the NANOOS presentation, shown below. This works great for the Salish Sea data but there are not as good IOOS presentations for the other 14 regions around the US where we have OFS predictions.


The above source is established and dependable, but NOAA has a new online viewer called OceansMap and it promises to include the currents and a lot more information, with versatile display options. As of now, it is still in beta form, so sometimes not all data are available. Also for now we can only see the time scale in EST (PST +3h).


Historically there have been several local guidelines for predicting the channel currents based on a single value of the tide height at La Conner or Seattle. Google "Current speed in Swinomish Channel" to see a few of them. And indeed some may work in some average conditions, but they cannot be dependable because of the wide range of environmental changes plus the area frequently has unusual tide patterns, such as the above example taken at random with high tide nearly all day long—essentially a diurnal pattern where it is normally semi-diurnal. 

In the picture below we used the SSCOFS data viewed in OceansMap and stepped through a days data, one hour at a time, and recorded the tide heights at the north and south ends, as well as the current near La Conner.  Then we did the old school method of subtracting the tides and plotted that along with the current.

So we see very nicely that this is the driving force of the current, which just confirms our original approach with modern data.  

But we no longer need this analysis. We just open one of the two apps above and get the current. Eventually the OceansMap will be the working tool as it has that neat meteogram optional display at the bottom that could be copied and saved in a phone.


Below are a couple more of these meteograms that compare currents in the channel with tide height at La Conner. Sometimes there is a correlation; other times not.


Earlier models of the Victoria Clipper, traveling from downtown Seattle to Victoria, BC, did sometimes transit the Channel when conditions in Puget Sound were very bad. This OFS data should make that planning better in those cases where it might come up again. The new Clippers are larger, so such careful planning is even more crucial.  

The channel has a mean tide height of 6.1 ft, with mean high water of 9.4 ft and mean low water of 2.7 ft. With dependable tide and current predictions, the Channel might be a more frequent option to Deception Pass for low-powered vessels, which then have the bonus of a visit to La Conner, which is a popular NW destination for good food, good art, and friendly people.

_______

For completeness, let me add that the wonderful GRIB versions of the OFS data we can get from Expedition and LuckGrib are fantastic for optimum routing over inland waters, but they must compromise on the grid size when converting the NetCDF to the GRIB format, and the resulting resolution is not adequate to use for the narrow Swinomish Channel. For this we need the two resources cited above. Also it seems Panoply which does load the full original data files, cannot resolve the data to that level either.


Digital Soundings and Water Depths from OFS Forecasts

$
0
0

The Operational Forecast System (OFS) model forecasts tide height and tidal currents for 15 locations around the country — a true revolution in modern marine navigation.

What is probably less known, is that we can potentially get the actual water depths for any point on the chart from these same forecasts.  These values should match the charted soundings and depth contours—to the extent that they are right, and indeed the OFS model bathymetry data are right as well.

Plus, we have to assume that the logic presented here is valid for extracting this information. So a main reason for this post is to have a way to ask the experts if this is a sound process.

When we then add the tide heights to the digital depths we have the forecasted water depth at any point in space and time, which would be another revolution in marine navigation. The concept of digital water depth has been planned to be part of the future S-100 electronic navigational charts (ENC), but I would like to show here that this is essentially available now.

When one of the OFS forecasts in netCDF format is downloaded from the NOAA AWS server and then opened in Panoply, we see these parameters from the San Francisco Bay model (SFBOFS).


u_eastward and v_northward are the vector components of the tidal current.

zetatomllw is the tide height, which is always relative to (above) MLLW.

But we also have

h, which is the depth of the water below MSL and 

zeta, which is the depth of the water above MSL.

(The parameter called Depth is just the number of depth layers where data are provided, which is 21, from 0 to 100 m.)

The diagram below shows how these parameters are related.


There are stand alone programs such as CDO that lets users combine parameters in a netCDF file and make a new file with the new parameters. So we have experimented with the process.

It seems we can get the total water level by just adding h and zeta, since they are both relative to MSL, even though that is not a datum used for this purpose in charting.

To obtain digital values of the soundings at any point on the chart, we need the depth relative to MLLW, not the h values in the native files, which are relative to MSL. The actual charted depths will be deeper than h by the difference between MLLW and MSL. 

But we can compute that value, which varies across a chart, because it is just the difference between zetatomllw and zeta, as shown in the diagram. Since in the nautical chart world, MLLW is the sounding datum defining zero tide height, this difference is just the tide height equivalent to MSL, which is a datum that NOAA lists for each of their tidal stations.

It is presented at tidesandcurrents.noaa.gov on each tidal station's home page. Below is a sample from Redwood City, CA.


We can then make a plot of this difference in Panoply and check for what it thinks this value is at each of the locations where the value is known. That plot looks like this:


The places where MSL is known in this area are shown in this figure.


In Panoply you can interrogate a point in a plot to get location and value, which we did at each of these locations. Samples are below.


The results are summarized in this table:


The agreement is good over a fairly large range of values, so it appears that this is a valid way to extract the MSL depth from the OFS data that we can use to compute chart depth from h.

Below is an example of a custom GRIB file made in the manner described and viewed in qtVlm—a popular free nav app for Mac and PC. It shows digitized chart depths in the region of SFBOFS just outside of the Golden Gate Bridge.


This shows the depth in feet, with a color gradient background designed to match the standard depth contours on US ENC. We end up with a display that is similar to an ENC depth area object  (DEPARE), but now we have digital values of the soundings any place on the chart. The famous Four Fathom Bank (yellow patch) stands out very nicely.

It will take more testing to be sure this is a productive useful addition to our navigation. We can now display the digital soundings (chart depths) and the digital water depth, which is chart depth + tide height.

It is a promising development, and new use of the OFS forecasts, but it will take some work to test its value.